


May 24, 2021 •OneAscent

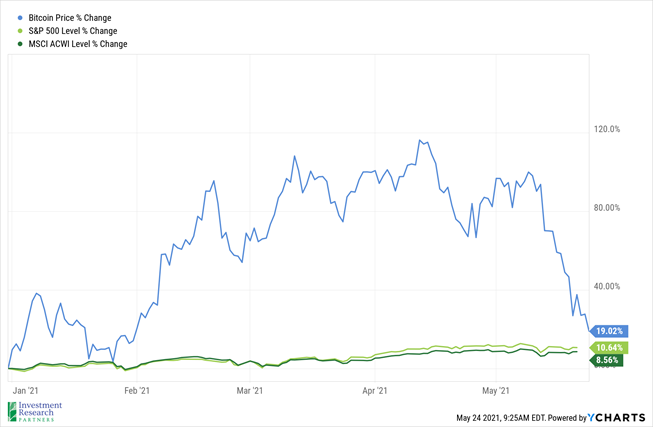
While equity markets were down slightly last week (the S&P 500 index lost -0.4%), it has still been a relatively strong start to the year for stocks, in general. The S&P 500, which is a proxy for large-cap US stocks, and the MSCI All Country World Index, a proxy for global large and mid-cap stocks, have gained 10.6% and 8.6%, respectively, so far in 2021. Even the NASDAQ index, which has trailed some other parts of the market as technology sector stocks have lagged this year following a strong 2020, has increased a respectable 4.5%[1].
However, investors in other parts of the market have experienced a much more volatile ride so far in 2021. For example, those with exposure to the cryptocurrency Bitcoin saw the price more than double from the beginning of the year through mid-April (see below). Unfortunately, those buying at the top have watched the price crater nearly 45% since that time[2], as Tesla CEO Elon Musk seemingly walked back his support and both the US Treasury and Internal Revenue Service (IRS) seem to be ratcheting up their scrutiny of cryptocurrencies as well.
While it is difficult (if not impossible) to predict where cryptocurrencies prices will go from here, we encourage investors to focus on long-term compounding of wealth and exercise extreme caution in more volatile and speculative assets like cryptocurrencies.
Prices & Interest Rates
| Representative Index | Current | Year-End 2020 |
|---|---|---|
| S&P 500 | 4,156 | 3,749 |
| Dow Jones Industrial Avg. | 34,207 | 30,497 |
| NASDAQ | 13,471 | 12,886 |
| Crude Oil (US WTI) | $63.58 | $48.52 |
| Gold | $1,877 | $1,893 |
| US Dollar | 89.81 | 89.94 |
| 2 Year Treasury | 0.17% | 0.13% |
| 10 Year Treasury | 1.63% | 0.93% |
| 30 Year Treasury | 2.33% | 1.65% |
| Source: Bloomberg, US Treasury as of May 21, 2021 |
Asset Class Returns
| Category | Representative Index | YTD 2021 | Full Year 2020 |
|---|---|---|---|
| Global Equity | MSCI All-Country World | 9.3% | 16.3% |
| US Large Cap Equity | S&P 500 | 11.3% | 18.4% |
| US Small Cap Equity | Russell 2000 | 12.6% | 20.0% |
| Foreign Developed Equity | MSCI EAFE | 9.1% | 7.8% |
| Emerging Market Equity | MSCI Emerging Markets | 3.6% | 18.3% |
| US High Yield Fixed Income | ICE BofAML High Yield Bond | 1.9% | 6.2% |
| US Fixed Income | Bloomberg Barclays US Aggregate Bond | -2.6% | 7.5% |
| Cash Equivalents | ICE BofAML 0-3 Mo Deposit | 0.0% | 0.5% |
| Source: Morningstar as of May 21, 2021 |
Source: YCharts
Source: YCharts
[1] Source: YCharts
[2] Source: Reuters - Bitcoin down almost 50% from year's high | Reuters
Past performance may not be representative of future results. All investments are subject to loss. Forecasts regarding the market or economy are subject to a wide range of possible outcomes. The views presented in this market update may prove to be inaccurate for a variety of factors. These views are as of the date listed above and are subject to change based on changes in fundamental economic or market-related data. Please contact your Financial Advisor in order to complete an updated risk assessment to ensure that your investment allocation is appropriate.