


May 17, 2021 •OneAscent

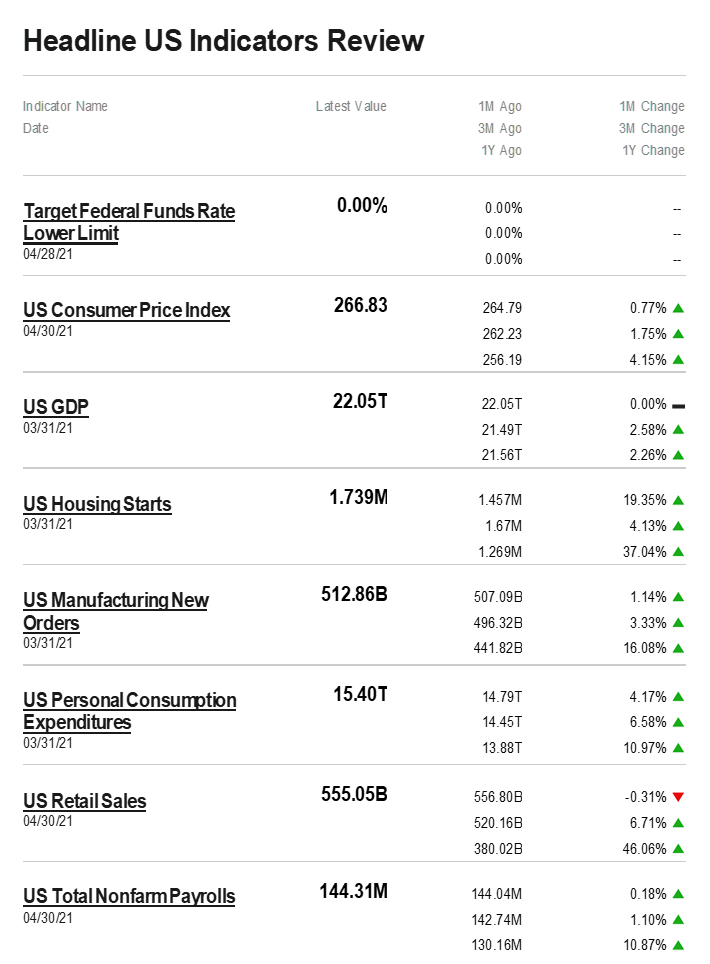
The S&P 500 index fell 1.4% last week, with the consumer discretionary and technology sectors leading the decline amid worries about increasing consumer and producer prices. The market benchmark ended the week at 4,174, down from last Friday's closing level of 4,233, which was a record closing high. Despite this week's drop, the index is up 11% for the year to date. The drop from last week's record levels came as data showed both the US consumer price index and producer price index rose by more than expected in April. The reports raised concerns about inflation, which investors fear could dent companies' margins and lead the Federal Reserve to end its easy monetary policies sooner. Fed officials have said inflation is transitory, but investors' worries remain.
Meanwhile, progress continued in the US on the COVID-19 front, with federal health officials saying fully vaccinated people no longer need to wear a mask or physically distance during outdoor or indoor activities, large or small. About 46% of American adults are fully vaccinated, according to the Centers for Disease Control & Prevention.
The S&P 500's weekly drop was broad, with all but three sectors in the red. The consumer discretionary sector had the largest percentage drop of the week, down 3.7%, followed by a 2.2% decline in technology. On the upside, consumer staples rose 0.4%, followed by a 0.3% increase in financials and a 0.1% lift in materials.
This week, the market will get a flurry of new readings on the housing market, with the National Association of Home Builders index for May due Monday, followed by reports on April building permits and housing starts on Tuesday, and April existing home sales on Friday. May readings on manufacturing and services purchasing managers' indexes are also due Friday.
Prices & Interest Rates
| Representative Index | Current | Year-End 2020 |
|---|---|---|
| S&P 500 | 4,169 | 3,749 |
| Dow Jones Industrial Avg. | 34,318 | 30,497 |
| NASDAQ | 13,387 | 12,886 |
| Crude Oil (US WTI) | $65.37 | $48.52 |
| Gold | $1,838 | $1,893 |
| US Dollar | 90.32 | 89.94 |
| 2 Year Treasury | 0.16% | 0.13% |
| 10 Year Treasury | 1.63% | 0.93% |
| 30 Year Treasury | 2.35% | 1.65% |
| Source: Bloomberg, US Treasury as of May 14, 2021 |
Asset Class Returns
| Category | Representative Index | YTD 2021 | Full Year 2020 |
|---|---|---|---|
| Global Equity | MSCI All-Country World | 8.8% | 16.3% |
| US Large Cap Equity | S&P 500 | 11.7% | 18.4% |
| US Small Cap Equity | Russell 2000 | 13.0% | 20.0% |
| Foreign Developed Equity | MSCI EAFE | 7.9% | 7.8% |
| Emerging Market Equity | MSCI Emerging Markets | 1.8% | 18.3% |
| US High Yield Fixed Income | ICE BofAML High Yield Bond | 2.0% | 6.2% |
| US Fixed Income | Bloomberg Barclays US Aggregate Bond | -2.7% | 7.5% |
| Cash Equivalents | ICE BofAML 0-3 Mo Deposit | 0.0% | 0.5% |
| Source: Morningstar as of May 14, 2021 |
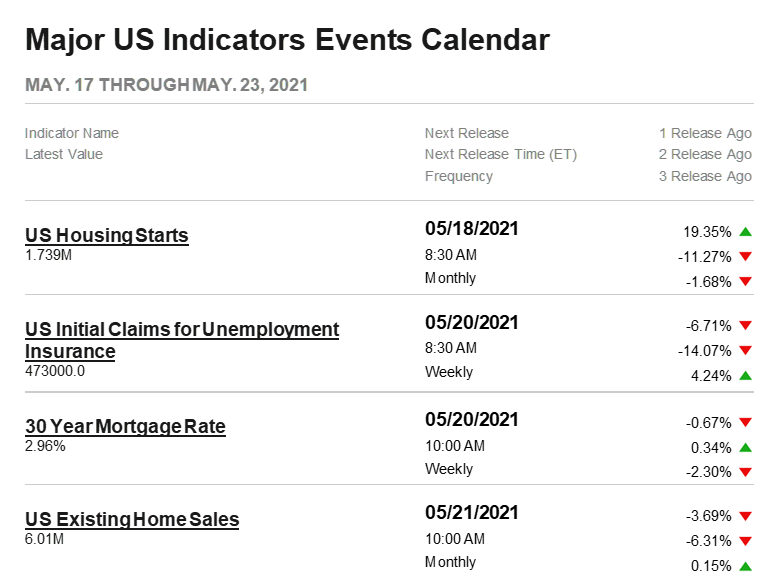
Source: YCharts
Source: YCharts
Past performance may not be representative of future results. All investments are subject to loss. Forecasts regarding the market or economy are subject to a wide range of possible outcomes. The views presented in this market update may prove to be inaccurate for a variety of factors. These views are as of the date listed above and are subject to change based on changes in fundamental economic or market-related data. Please contact your Financial Advisor in order to complete an updated risk assessment to ensure that your investment allocation is appropriate.