


May 10, 2021 •OneAscent

The labor market has continued its recovery, though the total number of employed Americans is still well-below pre-pandemic levels (see chart below). In early May, the US Bureau of Labor Statistics released their monthly assessment of labor market conditions. In a surprise disappointing report, the unemployment rate increased to 6.1% from 6.0% as only 266,000 new jobs were added to the economy while the consensus estimate from economists was expecting 1,000,000.
The economy remains more than 8 million jobs short of pre-pandemic levels, which allows significant room for labor market gains before capacity runs out, which has typically been a challenging point in economic cycles as wage inflation may begin to pressure company profitability on average. In April, leisure and hospitality jobs rose by 331,000 following similar gains during the previous two months as a sign that consumers are anxious to resume in-person activities like dining and travel.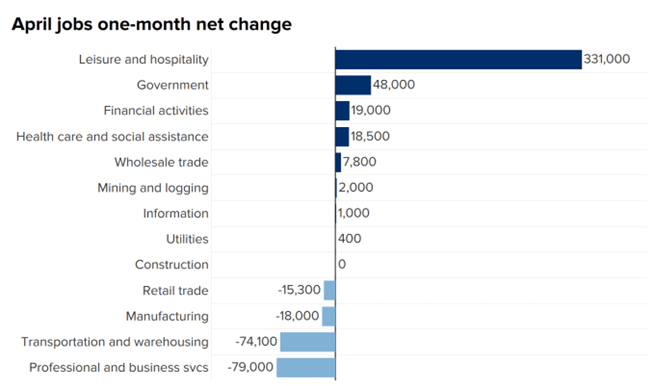
Source: Bureau of Labor Statistics
Key Economic Releases This Week
| Day | Report | Period | Consensus Est. | Previous |
|---|---|---|---|---|
| Wed., May 12 | Consumer Price Index (monthly rate) | April | 0.2% | 0.6% |
| Thursday, May 13 | Initial Unemployment Claims | Week of May 8th | 505,000 | 498,000 |
| Thursday, May 13 | Continuing Unemployment Claims | Week of May 1st | - | 3.69 million |
| Friday, May 14 | US Retail Sales (monthly rate) | April | 1.0% | 9.8% |
| Friday, May 14 | US Industrial Production (monthly rate) | April | 1.0% | 1.4% |
| Source: Bloomberg |
Asset Class Returns
| Category | Representative Index | YTD 2021 | Full Year 2020 |
|---|---|---|---|
| Global Equity | MSCI All-Country World | 10.5% | 16.3% |
| US Large Cap Equity | S&P 500 | 13.3% | 18.4% |
| US Small Cap Equity | Russell 2000 | 15.4% | 20.0% |
| Foreign Developed Equity | MSCI EAFE | 9.4% | 7.8% |
| Emerging Market Equity | MSCI Emerging Markets | 4.9% | 18.3% |
| US High Yield Fixed Income | ICE BofAML High Yield Bond | 2.3% | 6.2% |
| US Fixed Income | Bloomberg Barclays US Aggregate Bond | -2.3% | 7.5% |
| Cash Equivalents | ICE BofAML 0-3 Mo Deposit | 0.0% | 0.5% |
| Source: Morningstar as of May 7, 2021 |
Prices & Interest Rates
| Representative Index | Current | Year-End 2020 |
|---|---|---|
| S&P 500 | 4,225 | 3,749 |
| Dow Jones Industrial Avg. | 34,686 | 30,497 |
| NASDAQ | 13,710 | 12,886 |
| Crude Oil (US WTI) | $64.90 | $48.52 |
| Gold | $1,831 | $1,893 |
| US Dollar | 90.23 | 89.94 |
| 2 Year Treasury | 0.14% | 0.13% |
| 10 Year Treasury | 1.60% | 0.93% |
| 30 Year Treasury | 2.28% | 1.65% |
| Source: Bloomberg, US Treasury as of May 7, 2021 |
Past performance may not be representative of future results. All investments are subject to loss. Forecasts regarding the market or economy are subject to a wide range of possible outcomes. The views presented in this market update may prove to be inaccurate for a variety of factors. These views are as of the date listed above and are subject to change based on changes in fundamental economic or market-related data. Please contact your Financial Advisor in order to complete an updated risk assessment to ensure that your investment allocation is appropriate.