


July 15, 2021 •OneAscent

Despite a brief pullback on Thursday, equity markets ended the week on a positive note with many indexes near all-time highs. The S&P 500 index (a proxy for large-cap US stocks) has now gone more than eight months without a pullback of 5%[1].
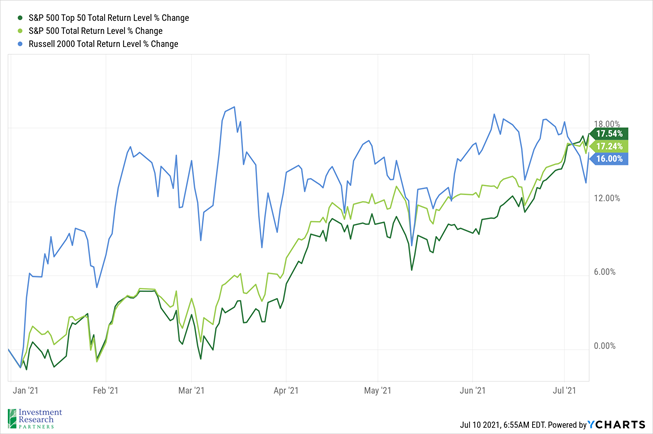
A major storyline earlier this year was that parts of the market that were battered most severely by Covid-19 last year, including many smaller companies, were bouncing back and outpacing many of their larger-cap peers as the vaccination rollout accelerated. That phenomenon is illustrated in the chart below, as the Russell 2000 (a proxy for small-cap US equities) easily outpaced both the S&P 500 and the S&P 500 Top 50 (large and largest-cap US equities, respectively) early in the year. However, that phenomenon has reversed course in the past two months as some of the largest companies have reemerged as market leaders.
It will be interesting to see if the executive order issued by President Biden on Friday has any impact on this dynamic. While it may take months for regulations related to the order to come to fruition, the President is focused on bolstering competition in the marketplace[2]. Many of the initiatives appear to be aimed at some of the largest companies in the US, which have benefitted from consolidation over the past two decades.
Prices & Interest Rates
| Representative Index | Current | Year-End 2020 |
|---|---|---|
| Crude Oil (US WTI) | $74.63 | $48.52 |
| Gold | $1,809 | $1,893 |
| US Dollar | 92.10 | 89.94 |
| 2 Year Treasury | 0.23% | 0.13% |
| 10 Year Treasury | 1.37% | 0.93% |
| 30 Year Treasury | 1.99% | 1.65% |
| Source: Morningstar, YCharts, and US Treasury as of July 10, 2021 |
Asset Class Returns
| Category | Representative Index | YTD 2021 | Full Year 2020 |
|---|---|---|---|
| Global Equity | MSCI All-Country World | 12.9% | 16.3% |
| US Large Cap Equity | S&P 500 | 17.2% | 18.4% |
| US Large Cap Equity | Dow Jones Industrial Average | 15.1% | 9.7% |
| US Small Cap Equity | Russell 2000 | 16.0% | 20.0% |
| Foreign Developed Equity | MSCI EAFE | 9.3% | 7.8% |
| Emerging Market Equity | MSCI Emerging Markets | 3.2% | 18.3% |
| US Fixed Income | Bloomberg Barclays Municipal Bond | 1.7% | 5.2% |
| US Fixed Income | Bloomberg Barclays US Agg Bond | -1.2% | 7.5% |
| Global Fixed Income | Bloomberg Barclays Global Agg. Bond | -2.8% | 9.2% |
| Source: YCharts as of June 26, 2021 |
[1] ‘A Narrative of Fear’: Plunging Stocks Finally Heed Bond Signal - Bloomberg
[2] Biden’s Push for More Competition: What’s in the Executive Order - Bloomberg
Download PDF Version
Past performance may not be representative of future results. All investments are subject to loss. Forecasts regarding the market or economy are subject to a wide range of possible outcomes. The views presented in this market update may prove to be inaccurate for a variety of factors. These views are as of the date listed above and are subject to change based on changes in fundamental economic or market-related data. Please contact your Financial Advisor in order to complete an updated risk assessment to ensure that your investment allocation is appropriate.