


April 27, 2021 •OneAscent

Since 1987, the American Association of Individual Investors (AAII) has published survey results of investors that simply asks the question, “What direction do AAII members feel the stock market will be in the next six months?” While the results are often mixed, the survey could be utilized by portfolio managers to identify periods of excessive optimism or pessimism regarding the stock market. The classic quote from famed investor, Warren Buffet, “Be greedy when others are fearful and fearful when others are greedy” summarizes this concept quite well.
In the most recent survey result below, we can see that investor optimism in April is well above long-term averages. And, in fact, the ratio of bulls-to-bears is meaningfully above average as well. This is not to say that there is imminent threat of an irrationally exuberant market like those witnessed in technology stocks in the late 1990s or home prices in 2005-2007, but this data is worth noting when evaluating the overall environment for taking investment risks.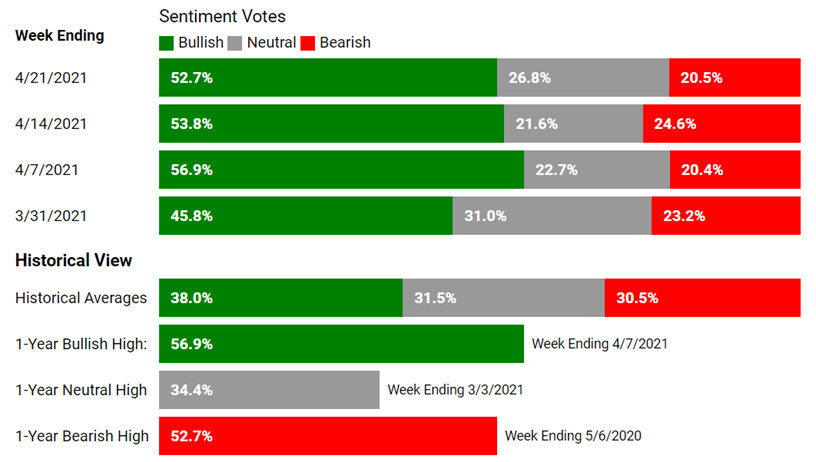
Source: American Association of Individual Investors
Key Economic Releases This Week
| Day | Report | Period | Consensus Est. | Previous |
|---|---|---|---|---|
| Thurs., April 27 | US Gross Domestic Product (annual rate) | Q1 2021 | 6.5% | 4.3% |
| Thurs., April 27 | Initial Unemployment Claims | Week of 4/24/21 | 528,000 | 547,000 |
| Friday, April 28 | Personal Income (monthly rate) | March | 20.0% | -7.1% |
| Friday, April 28 | Consumer Spending (monthly rate) | March | 4.0% | -1.0% |
| Friday, April 28 | Core Inflation (monthly rate) | March | 0.3% | 0.1% |
| Source: Bloomberg |
Asset Class Returns
| Category | Representative Index | YTD 2021 | Full Year 2020 |
|---|---|---|---|
| Global Equity | MSCI All-Country World | 9.8% | 16.3% |
| US Large Cap Equity | S&P 500 | 12.0% | 18.4% |
| US Small Cap Equity | Russell 2000 | 16.7% | 20.0% |
| Foreign Developed Equity | MSCI EAFE | 7.9% | 7.8% |
| Emerging Market Equity | MSCI Emerging Markets | 5.8% | 18.3% |
| US High Yield Fixed Income | ICE BofAML High Yield Bond | 1.9% | 6.2% |
| US Fixed Income | Bloomberg Barclays US Aggregate Bond | -2.5% | 7.5% |
| Cash Equivalents | ICE BofAML 0-3 Mo Deposit | 0.0% | 0.5% |
| Source: Morningstar as of April 26, 2021 |
Prices & Interest Rates
| Representative Index | Current | Year-End 2020 |
|---|---|---|
| S&P 500 | 4,180 | 3,749 |
| Dow Jones Industrial Avg. | 33,877 | 30,497 |
| NASDAQ | 14,012 | 12,886 |
| Crude Oil (US WTI) | $62.36 | $48.52 |
| Gold | $1,779 | $1,893 |
| US Dollar | 90.81 | 89.94 |
| 2 Year Treasury | 0.18% | 0.13% |
| 10 Year Treasury | 1.58% | 0.93% |
| 30 Year Treasury | 2.24% | 1.65% |
| Source: Bloomberg, US Treasury as of April 26, 2021 |
Past performance may not be representative of future results. All investments are subject to loss. Forecasts regarding the market or economy are subject to a wide range of possible outcomes. The views presented in this market update may prove to be inaccurate for a variety of factors. These views are as of the date listed above and are subject to change based on changes in fundamental economic or market-related data. Please contact your Financial Advisor in order to complete an updated risk assessment to ensure that your investment allocation is appropriate.