


April 19, 2021 •OneAscent

The University of Michigan released preliminary April results for its Survey of Consumers. The measure is based on surveys of households (“consumers”) about their current financial conditions as well as expectations for their future and the future of the economy in general. According to the University’s Chief Economist, Richard Curtin, consumers in April reporting surging economic growth and strong job gains due to record stimulus spending, low interest rates, and the positive impact of vaccinations. The sentiment measure rose to its best level of the year based on survey respondents’ assessment of current economic conditions, though their expectation for future economic conditions was relatively unchanged. Notably, consumers expect inflation in the year ahead to be significantly above average at 3.7%, the highest level expected in nearly a decade. Half of all consumers surveyed expected future declines in unemployment, the highest level ever recorded in the expectations survey.[1]
The chart below highlights readings for the survey over the last 50 years with recessions shaded in gray. The April preliminary readying of 86.5 is not included in the chart. Household sentiment appears to be rebounding quickly and still has significant room to advance.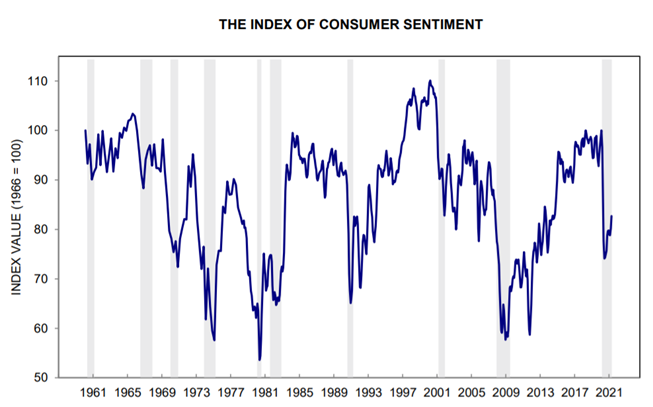
Source: University of Michigan
Key Economic Releases This Week
| Day | Report | Period | Consensus Est. | Previous |
|---|---|---|---|---|
| Thursday, April 22nd | Initial Unemployment Claims | Week of April 17th | 608,000 | 576,000 |
| Leading Economic Indicators (monthly rate) | March | 0.9% | 0.2% | |
| Friday, April 23rd | Markit Manufacturing PMI (flash) | April | 60.5 | 59.1 |
| Markit Services PMI (flash) | April | 61.0 | 60.4 | |
| New Home Sales (annual rate) | March | 893,000 | 775,000 | |
| Source: Bloomberg |
Asset Class Returns
| Category | Representative Index | YTD 2021 | Full Year 2020 |
|---|---|---|---|
| Global Equity | MSCI All-Country World | 9.6% | 16.3% |
| US Large Cap Equity | S&P 500 | 11.9% | 18.4% |
| US Small Cap Equity | Russell 2000 | 14.9% | 20.0% |
| Foreign Developed Equity | MSCI EAFE | 7.9% | 7.8% |
| Emerging Market Equity | MSCI Emerging Markets | 4.9% | 18.3% |
| US High Yield Fixed Income | ICE BofAML High Yield Bond | 1.9% | 6.2% |
| US Fixed Income | Bloomberg Barclays US Aggregate Bond | -2.6% | 7.5% |
| Cash Equivalents | ICE BofAML 0-3 Mo Deposit | 0.0% | 0.5% |
| Source: Morningstar as of April 16, 2021 |
Prices & Interest Rates
| Representative Index | Current | Year-End 2020 |
|---|---|---|
| S&P 500 | 4,176 | 3,749 |
| Dow Jones Industrial Avg. | 34,081 | 30,497 |
| NASDAQ | 14,030 | 12,886 |
| Crude Oil (US WTI) | $63.13 | $48.52 |
| Gold | $1,779 | $1,893 |
| US Dollar | 91.56 | 89.94 |
| 2 Year Treasury | 0.16% | 0.13% |
| 10 Year Treasury | 1.59% | 0.93% |
| 30 Year Treasury | 2.26% | 1.65% |
| Source: Bloomberg, US Treasury as of April 16, 2021 |
[1] http://www.sca.isr.umich.edu/
Past performance may not be representative of future results. All investments are subject to loss. Forecasts regarding the market or economy are subject to a wide range of possible outcomes. The views presented in this market update may prove to be inaccurate for a variety of factors. These views are as of the date listed above and are subject to change based on changes in fundamental economic or market-related data. Please contact your Financial Advisor in order to complete an updated risk assessment to ensure that your investment allocation is appropriate.