


August 13, 2021 •Rob Riley

I hate a song that makes you think that you are not any good. I hate a song that makes you think that you are just born to lose. Bound to lose. No good to nobody. No good for nothing. Because you are too old or too young or too fat or too slim or too ugly or too this or too that. Songs that run you down or poke fun at you on account of your bad luck or hard traveling. I am out to fight those songs to my very last breath of air and my last drop of blood... I decided a long time ago that I’d starve to death before I’d sing any such songs as that. The radio waves and your movies and your jukeboxes and your songbooks are already loaded down and running over with such no good songs as that anyhow.
This quote is from Woody Guthrie, writer of “This Land Is Your Land” and a primary influence for Bob Dylan. Mr. Guthrie rightly notes that artists send messages—and we argue that investment professionals do, too. Unfortunately, many of the messages in the world of investments are the kind Mr. Guthrie would abhor. Turn on the news, and watch the dance of the red and green tickers and arrows flowing back and forth. Jargon, acronyms, and bold predictions fill the columns and airwaves.
At best, investing messages are confusing. At worst, and perhaps most often, investing messages produce and provoke fear and cynicism.
Fear is a powerful motivator. It removes our focus from our long-term goals and fixates our gaze on short-term situations that we cannot control. While issues like inflation, unemployment, and political shifts dominate headlines, reactionary deployment and allocation of capital often lead to overcorrection. When you learned to drive, you learned to guide the wheel and apply the brakes gently, trusting the vehicle to stay on course in a storm. This is a wise approach to investing, as well.
Vanguard depicts what can happen when investors try to ‘time’ the market, selling assets at a perceived high and attempting to ‘buy the dip.’ The chart below shows average fund returns vs. average investor returns for the decade surrounding the Great Recession (2005-2014).
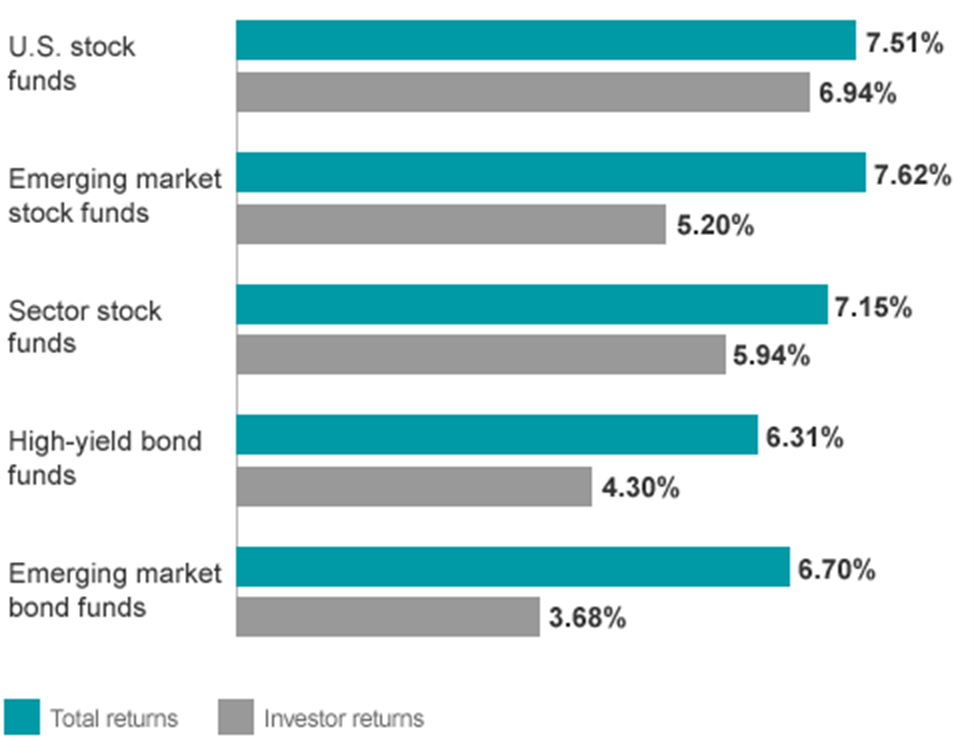
Similarly, the 20-year outlook for the average investor who wavers from their plan is not promising. As you can see below, making hasty, inconsistent decisions can lead to barely beating inflation in the long run.
-OneAscent-Financial-Stay-Invested-Rob-Riley.png)
Sources: J.P. Morgan Asset Management – Guide to the Markets, Dalbar Inc.
Indices used are as follows: REITS: NAREIT Equity REIT Index, EAFE: MSCI EAFE, Oil: WTI Index, Bonds: Bloomberg Barclays U.S. Aggregate Index, Homes: median sale price of existing single-family homes, Gold: USD/troy oz., Inflation: CPI, 60/40: A balanced portfolio with 60% invested in S&P 500 Index and 40% invested in high-quality U.S. fixed income, represented by the Bloomberg Barclays U.S. Aggregate Index. The portfolio is rebalanced annually. Average asset allocation investor return is based on an analysis by Dalbar Inc., which utilizes the net of aggregate mutual fund sales, redemptions and exchanges each month as a measure of investor behavior. Returns are annualized (and total return where applicable) and represent the 20-year period ending 12/31/18 to match Dalbar’s most recent analysis.
Investing scared can lead to similar results as driving scared—you arrive at your destination later and more tense than if you had remained calm.
Let’s say that fear drove you to dip out of the market in March 2020. The chart below could appear next to ‘volatility’ in the dictionary, but it’s an important case study for investing.
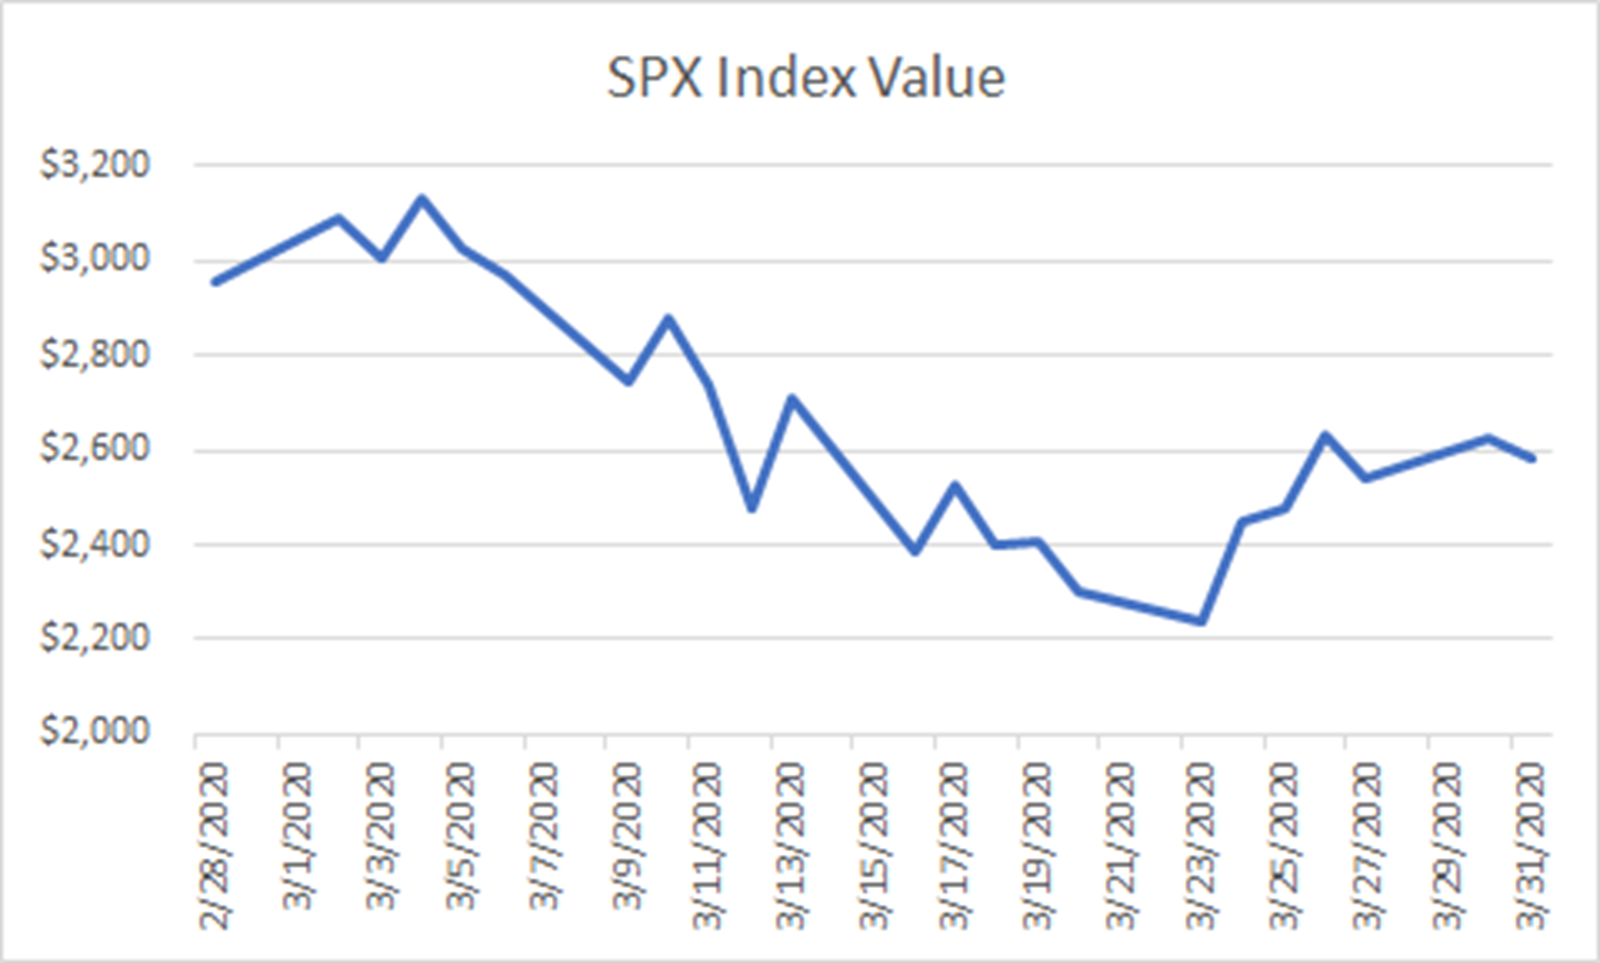
If you sold out of the S&P 500 at the bottom on March 23, for instance, you missed a 9.4 percent gain the next day and a 15.5 percent gain to close out the month. In one of the worst market months in recent memory, the S&P closed higher than it opened 10 out of 22 days, almost half the time. The pandemic recession began in mid-February, and with hindsight we now know that if you held, you made your money back in nearly six months to the day.
However, if you’ve been burned by divesting too early or buying back in at the peak, this can lead to cynicism. Cynicism makes us think that our actions don’t lead to our desired outcomes, and this is a disheartening place to be.
The questions to maintain perspective amidst cynicism are these:
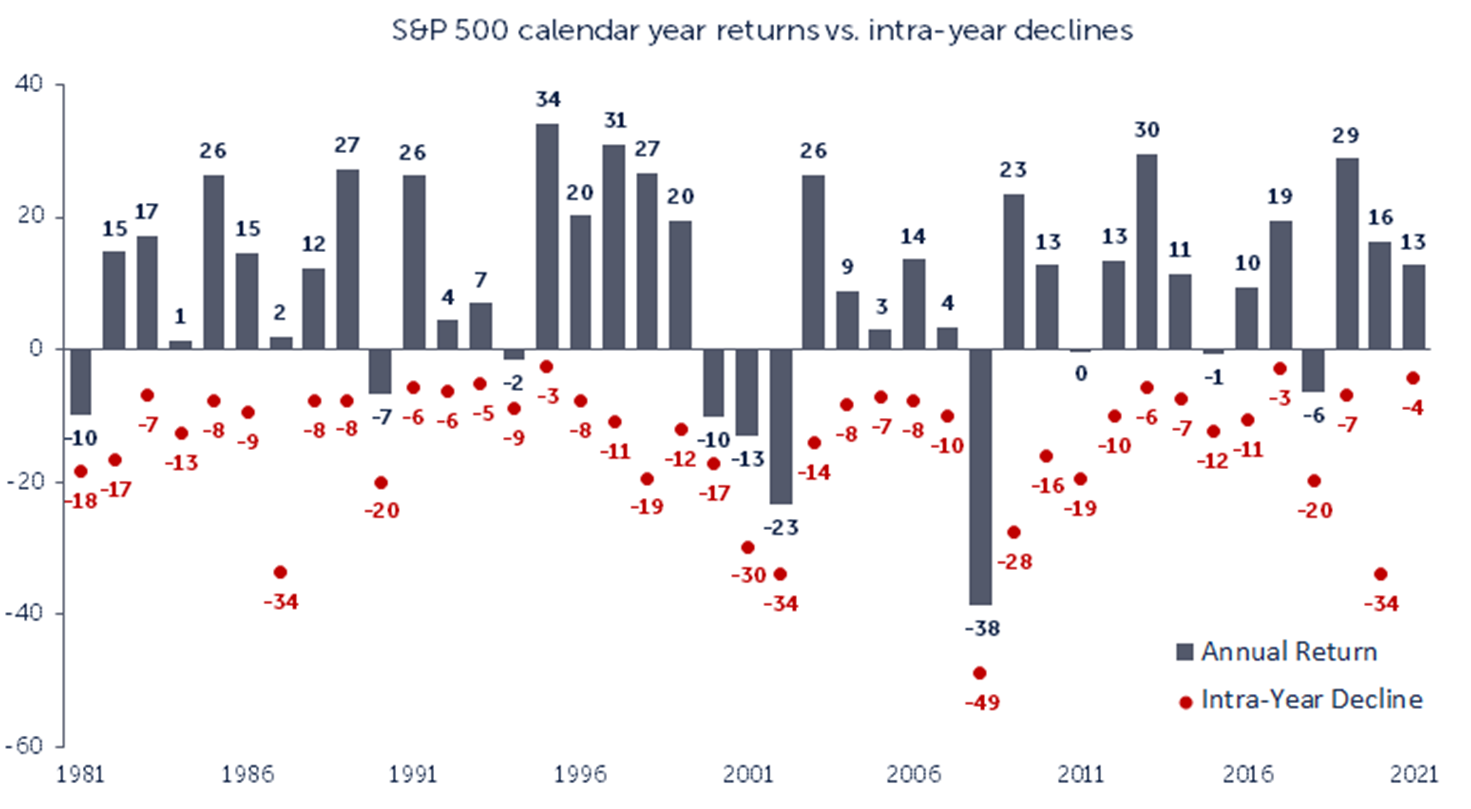
The answer to that last question is likely ‘yes.’ The chart below depicts the S&P 500’s annual returns for the pasts 40 years, while also showing how far the market dipped at one point in the year. The average intra-year decline was -14.2%, yet the market still finished in positive territory in 30 out of the 40 years!
Sources: Morningstar, OneAscent Investment Solutions.
Returns are based on price index only and do not include dividends. Intra-year drops refer to the largest market drops from a peak to a trough during the year. For illustrative purposes only. Returns shown are calendar year returns from 1981 to 2020, over which time period the average annual return was 9.9%. Data as of 5/31/2021.
Fear and cynicism will always be a distracting temptation. So, what is the antidote?
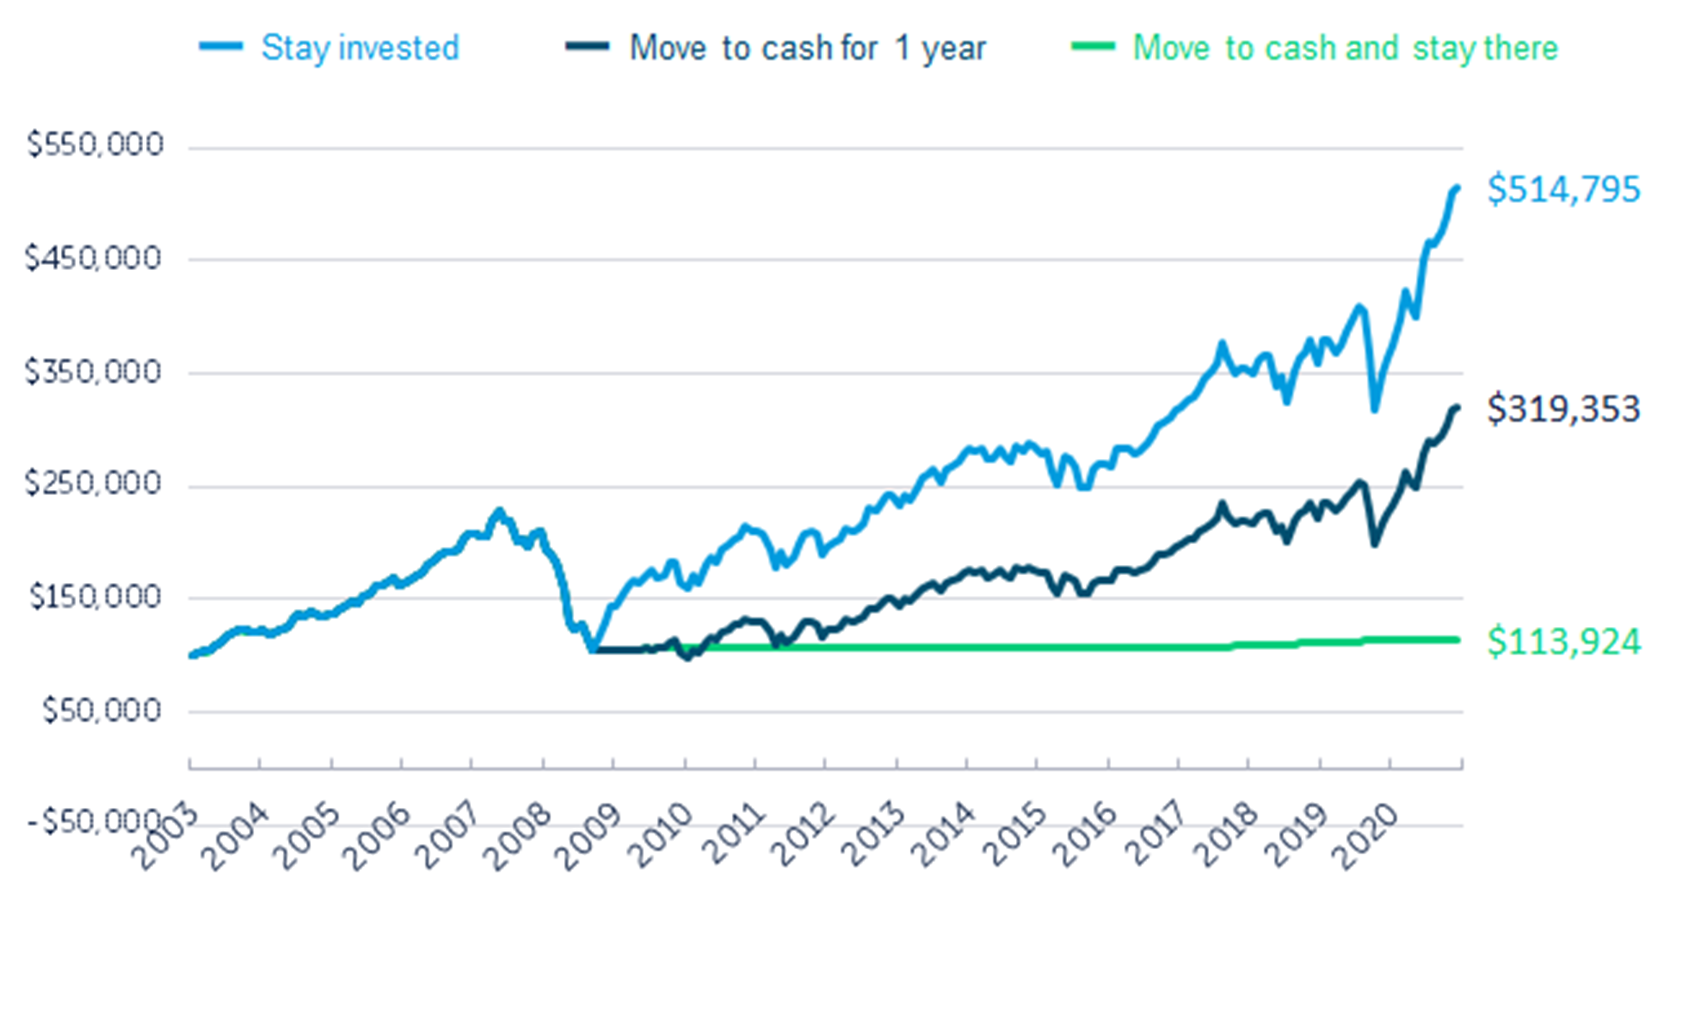
Investing is all about confidence. If your investments align with your values, your advisor is in your corner, your plan is thorough, your managers are experienced, and your allocation is well-diversified, it may be wise to stay the course. The charts above focus on percentage changes, but what about actual dollars? What’s the ROI of staying invested when the world may look grim?
Sources: Morningstar Direct.
Data from 6/30/2003 to 5/31/2021. “Stay invested” is represented by the MSCI ACWI NR Index while “Move to cash for 1 year” is represented by the ICE BofA US Treasury Bill TR Index. Returns are annualized (and total return where applicable). References to specific asset classes should not be viewed as a recommendation to buy or sell. Investors may not invest directly into an index.
Staying invested when things get tough could be the difference between achieving your goals and missing the mark. Though past performance can’t predict the future, what does history say about staying in the market in good times and bad?
Sources: Morningstar Direct.
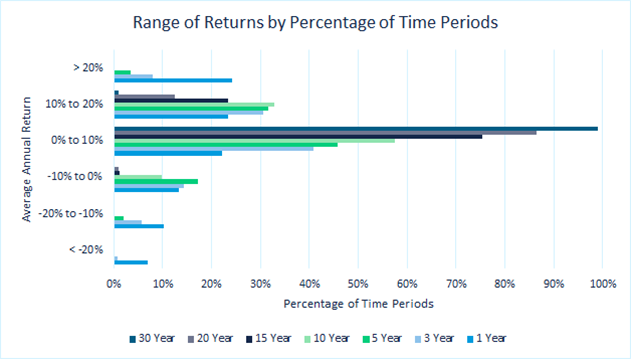
Data from 12/31/1929 to 5/31/2021. Data includes daily SPX Close prices.
The chart above depicts how often a time-horizon returned a certain range of average annual return. The data set begins in 1930 and ends in 2021. Amidst World Wars, a tech bubble, a housing bubble, elections, regulations, deregulations, a Great Depression, multiple recessions, and a global pandemic, the market pressed on. The market pressed on because innovation, adaptation, entrepreneurship, employment, healthcare, transportation, agriculture, education, and infrastructure pressed on.
If you picked a date in the last 80 years out of a hat, invested in the S&P 500, and held for 30 years, you would have had a positive average annual return 100 percent of the time. What about 15 or 20 years? 99 percent of the time. Fight fear and cynicism with confidence in the process.
So keep your head up, and receive this good news. Investing is the process of active patience, monitoring and adjusting without nitpicking and over-correcting. So while you are at work, laboring to grow your business, clientele, and resume, you’re actually contributing to the market pressing on. While you work, you can rest knowing that your values-aligned financial advisor is always keeping watch, always refining your plan and goals with you, and always encouraging you to stay the course.

Past performance may not be indicative of future results. Therefore, no current or prospective client should assume that the future performance of any specific investment, investment strategy (including the investments and/or investment strategies recommended by the adviser), will be profitable or equal to past performance levels.
This material is intended to be educational in nature, and not as a recommendation of any particular strategy, approach, product or concept for any particular advisor or client. These materials are not intended as any form of substitute for individualized investment advice. The discussion is general in nature, and therefore not intended to recommend or endorse any asset class, security, or technical aspect of any security for the purpose of allowing a reader to use the approach on their own. Before participating in any investment program or making any investment, clients as well as all other readers are encouraged to consult with their own professional advisers, including investment advisers and tax advisors. OneAscent can assist in determining a suitable investment approach for a given individual, which may or may not closely resemble the strategies outlined herein.
Any charts, graphs, or visual aids presented herein are intended to demonstrate concepts more fully discussed in the text of this brochure, and which cannot be fully explained without the assistance of a professional from OneAscent. Readers should not in any way interpret these visual aids as a device with which to ascertain investment decisions or an investment approach. Only your professional adviser should interpret this information.
The S&P 500 is an unmanaged index used as a general measure of market performance. You cannot invest directly in an index. Accordingly, performance results for investment indexes do not reflect the deduction of transaction and/or custodial charges or the deduction of an investment-management fee, the incurrence of which would have the effect of decreasing historical performance results.
Past performance may not be representative of future results. All investments are subject to loss. Forecasts regarding the market or economy are subject to a wide range of possible outcomes. The views presented in this market update may prove to be inaccurate for a variety of factors. These views are as of the date listed above and are subject to change based on changes in fundamental economic or market-related data. Please contact your Financial Advisor in order to complete an updated risk assessment to ensure that your investment allocation is appropriate.