


October 6, 2021 •OneAscent

 |
|
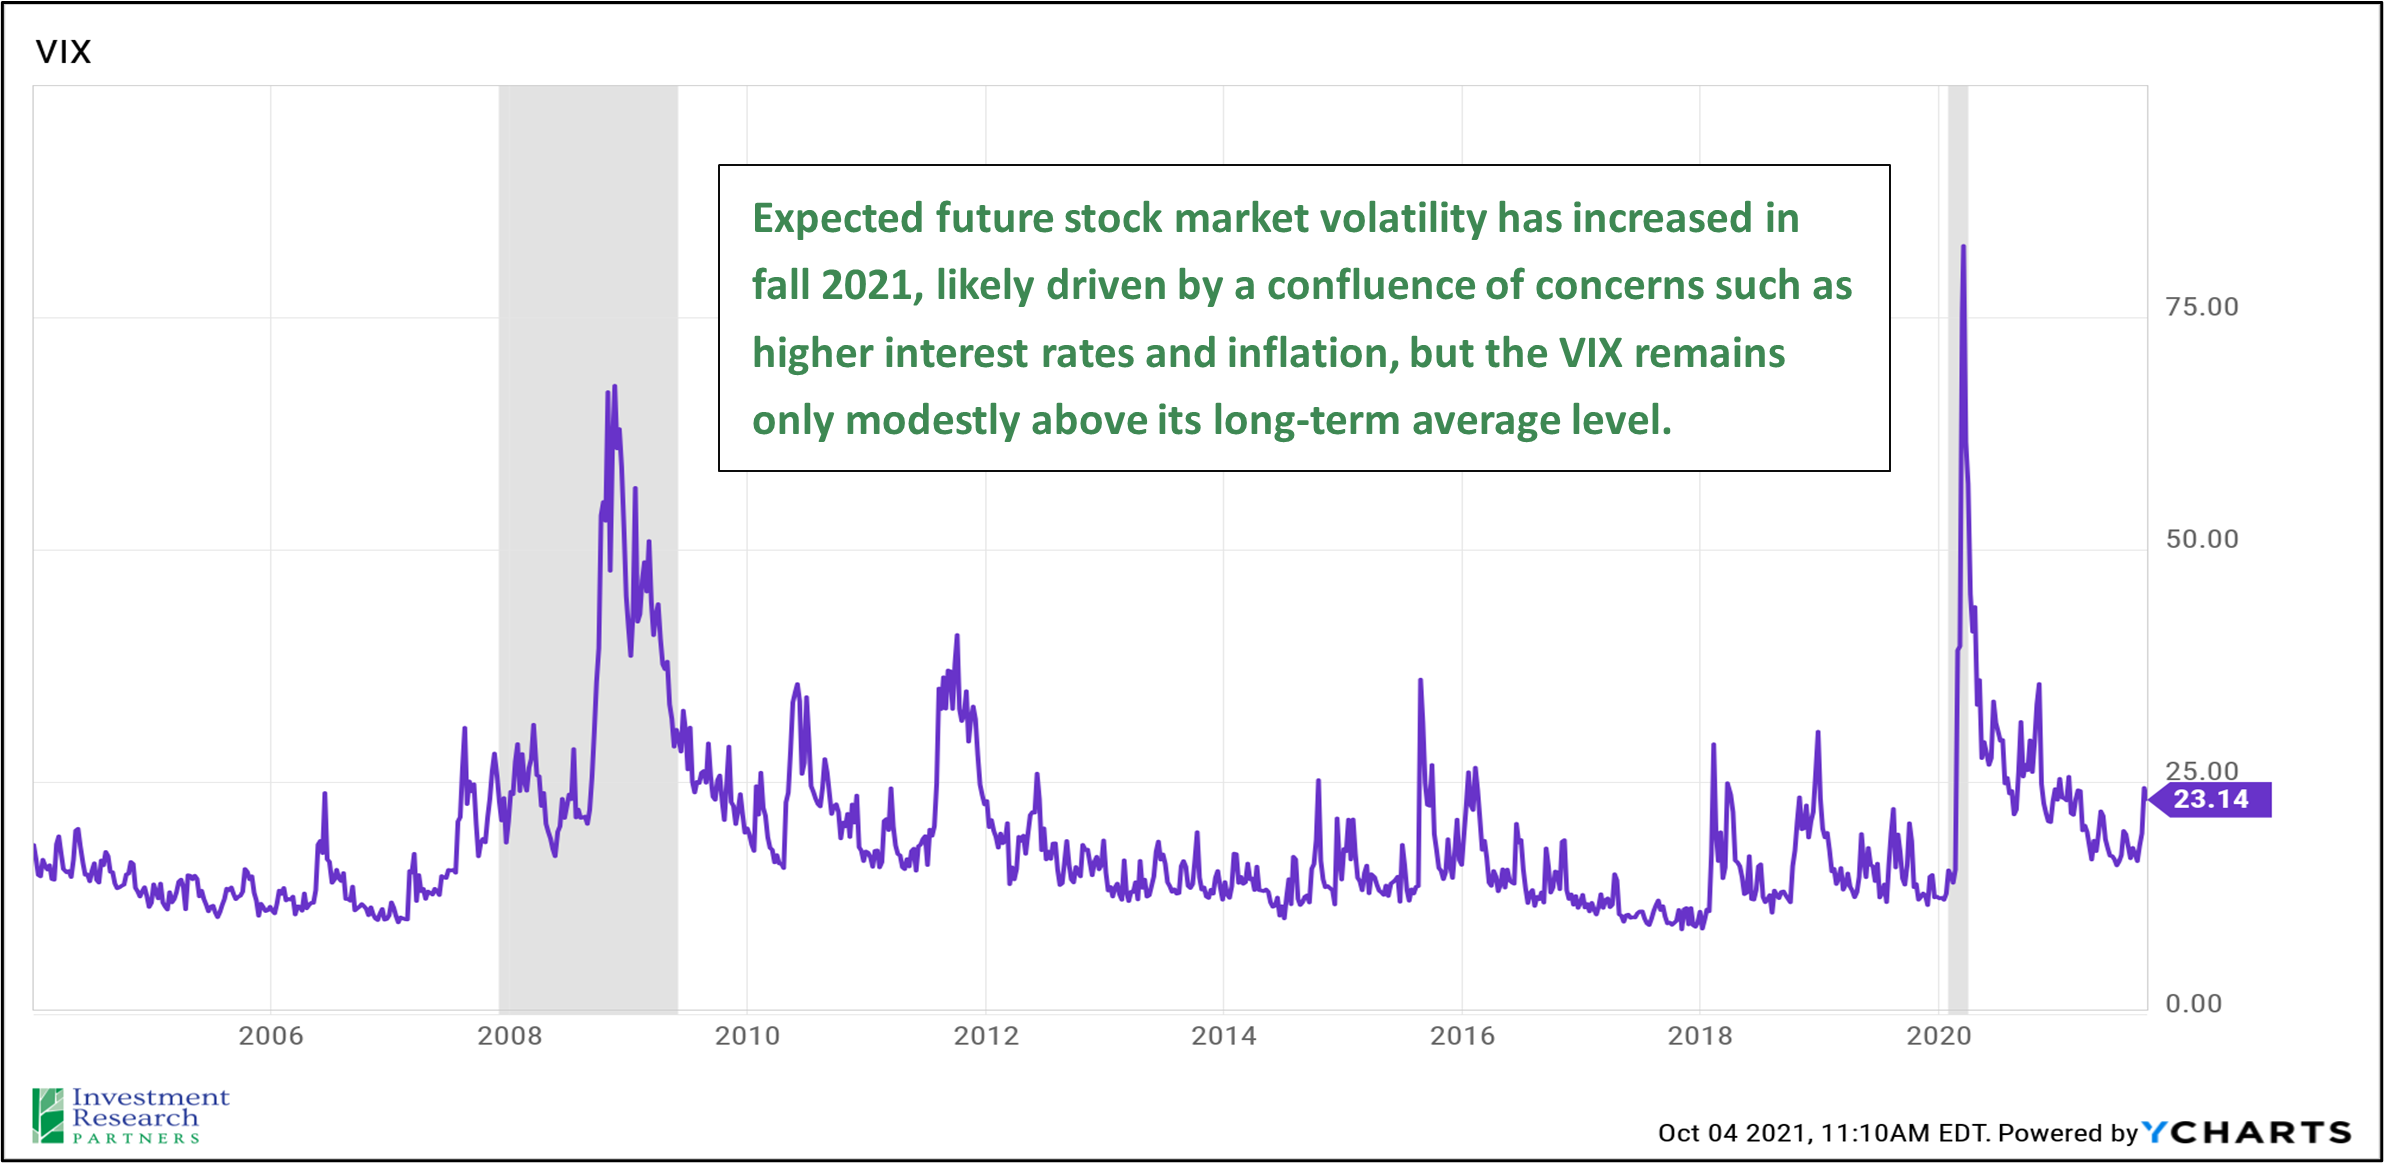
After being relatively muted for much of 2021, market volatility has returned this fall. The CBOE VIX Index measures the implied volatility of the S&P 500 market index and is sometimes referred to as a “fear gauge” because it measures the range of outcomes expected by investors for the stock market. So, a higher VIX translates to increased expectations for large potential swings of the S&P 500. As of early October, the VIX has been in the low-to-mid 20s, which is modestly above the long-term average of approximately 20.
Changes in market volatility are normal, particularly as new perceived risks such as the potential for higher interest rates and inflation are more prevalent in investors’ considerations when pricing risk assets such as equities. Despite the uptick in volatility, our overall assessment of the environment for risk-taking remains neutral. However, as we’ve communicated consistently for the past several months, we have been advocating investors consider:
The economy remains healthy on average; households are in good financial shape, seeing wage gains, and spending. The labor market is improving, and financial conditions are quite accommodative. Risk asset classes such as equities and credit are trading above long-term averages, which is the primary factor holding back the overall risk-taking score. We are actively monitoring potential headwinds to US economic growth such as the COVID-19 delta variant, inflation, supply chain gaps, and potential tax increases.
S&P 500 Intra-Year Declines vs. Calendar Year Returns
Despite average intra-year declines of 14.3%, annual returns were positive in 31 of the last 41 years 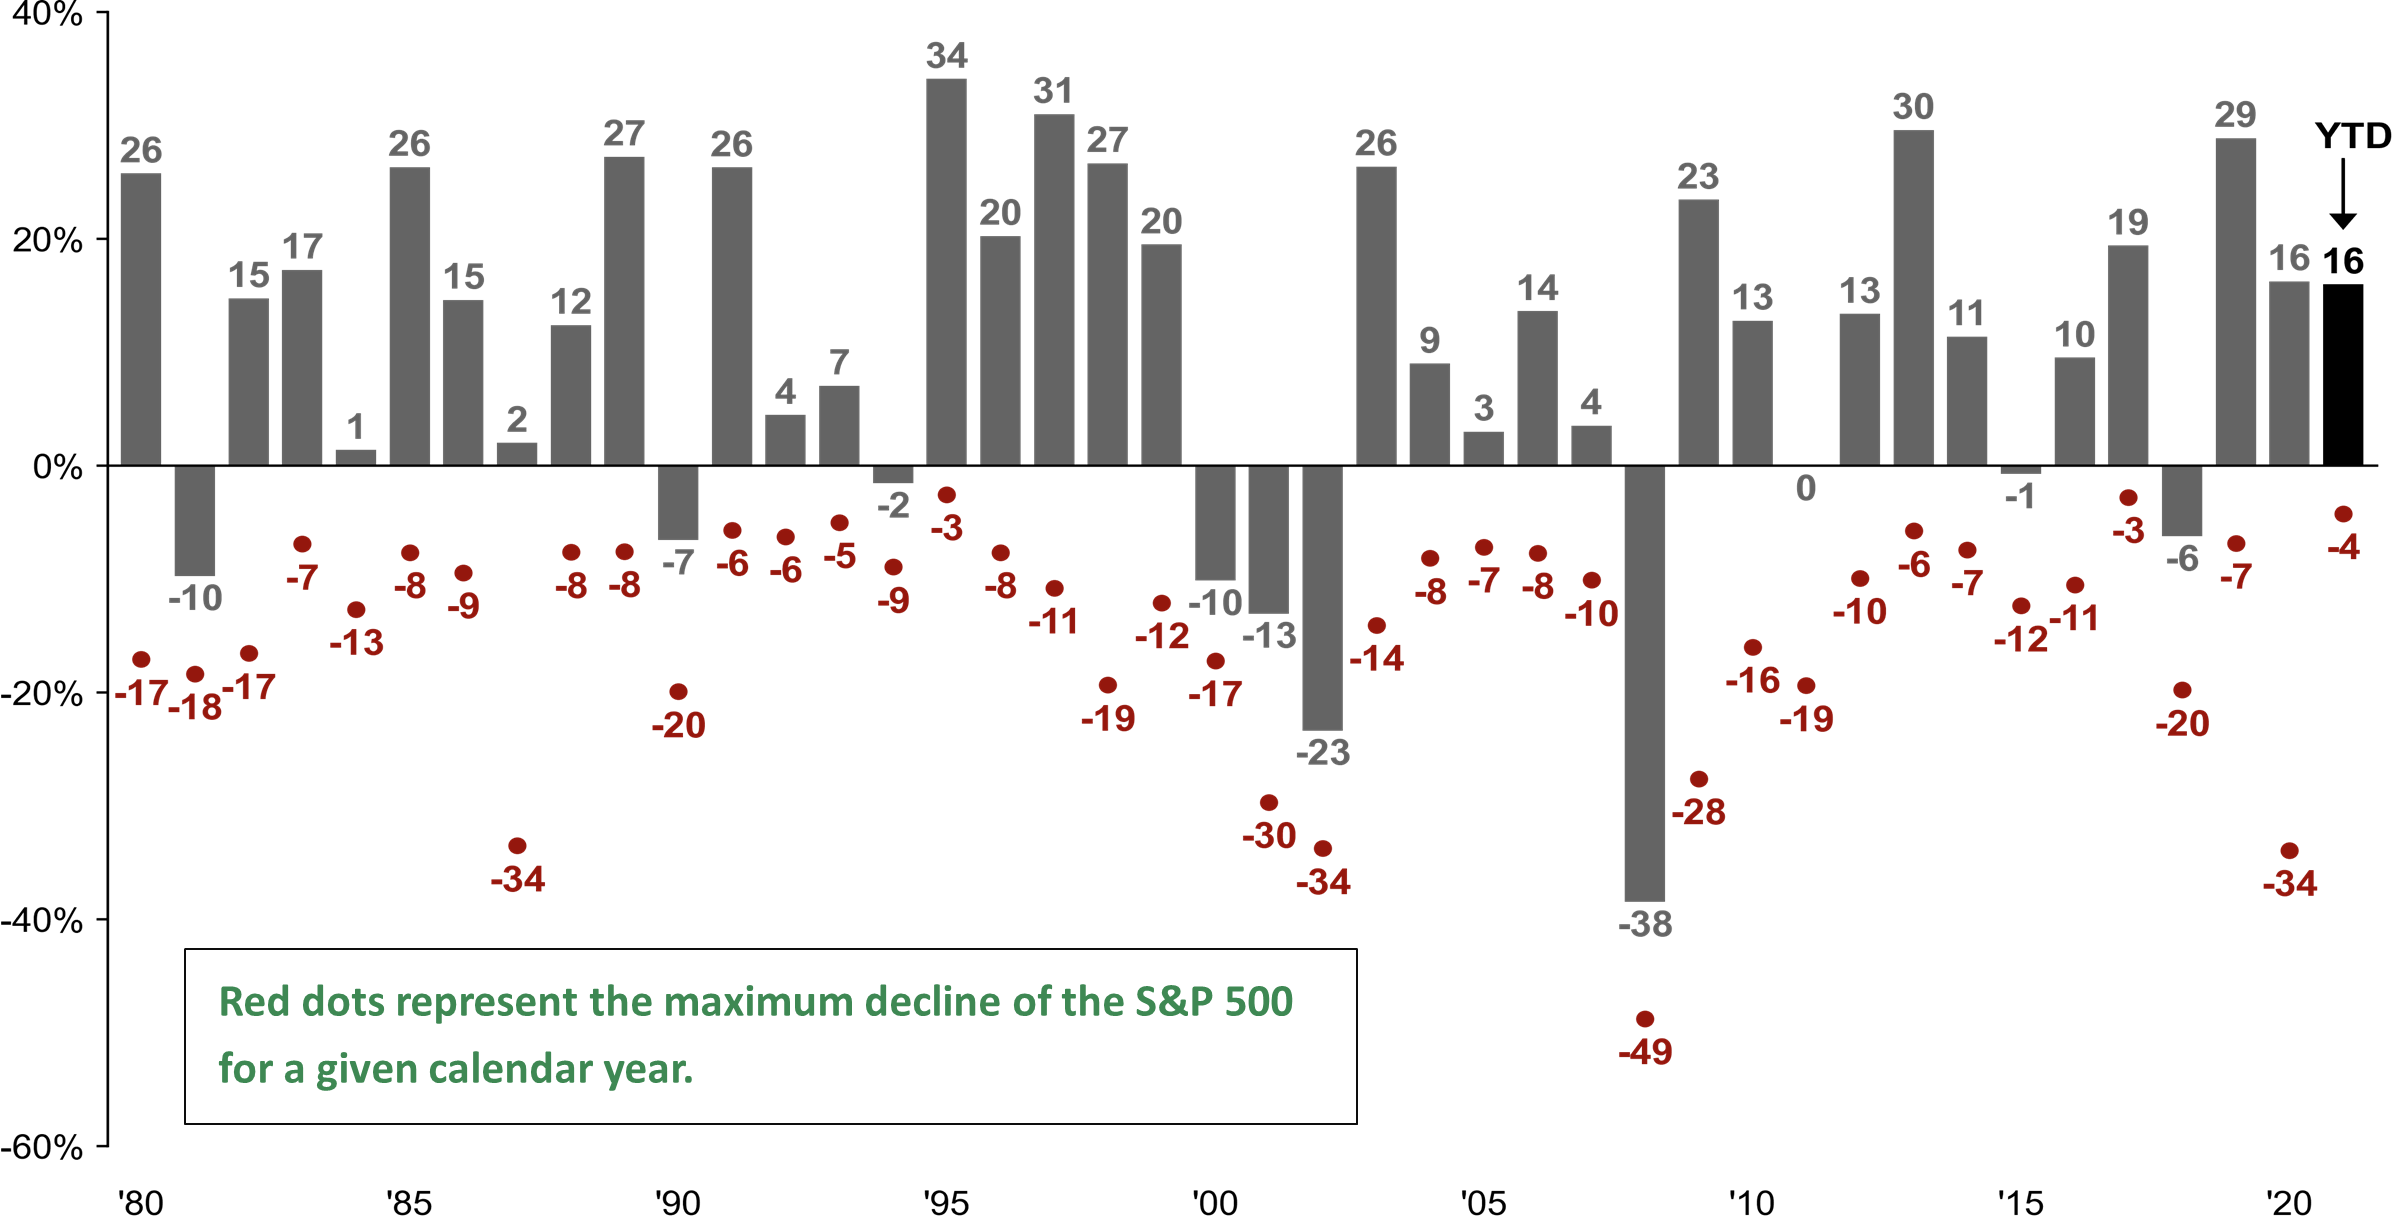 Source: FactSet, Standard & Poor’s, J.P. Morgan Asset Management. Returns are based on price index only and do not include dividends. Intra-year drops refers to the largest market drops from a peak to a trough during the year. For illustrative purposes only. Returns shown are calendar year returns from 1980 to 2020, over which time period the average annual return was 9.0%. Guide to the Markets – U.S. Data are as of September 20, 2021.
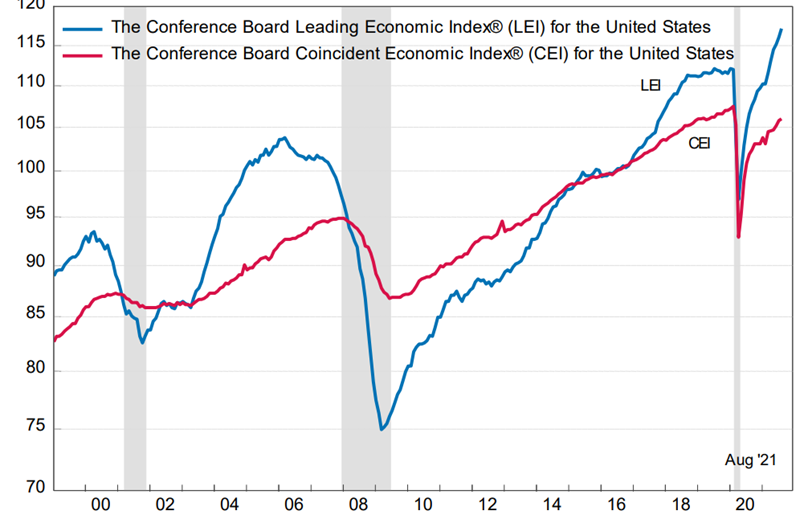
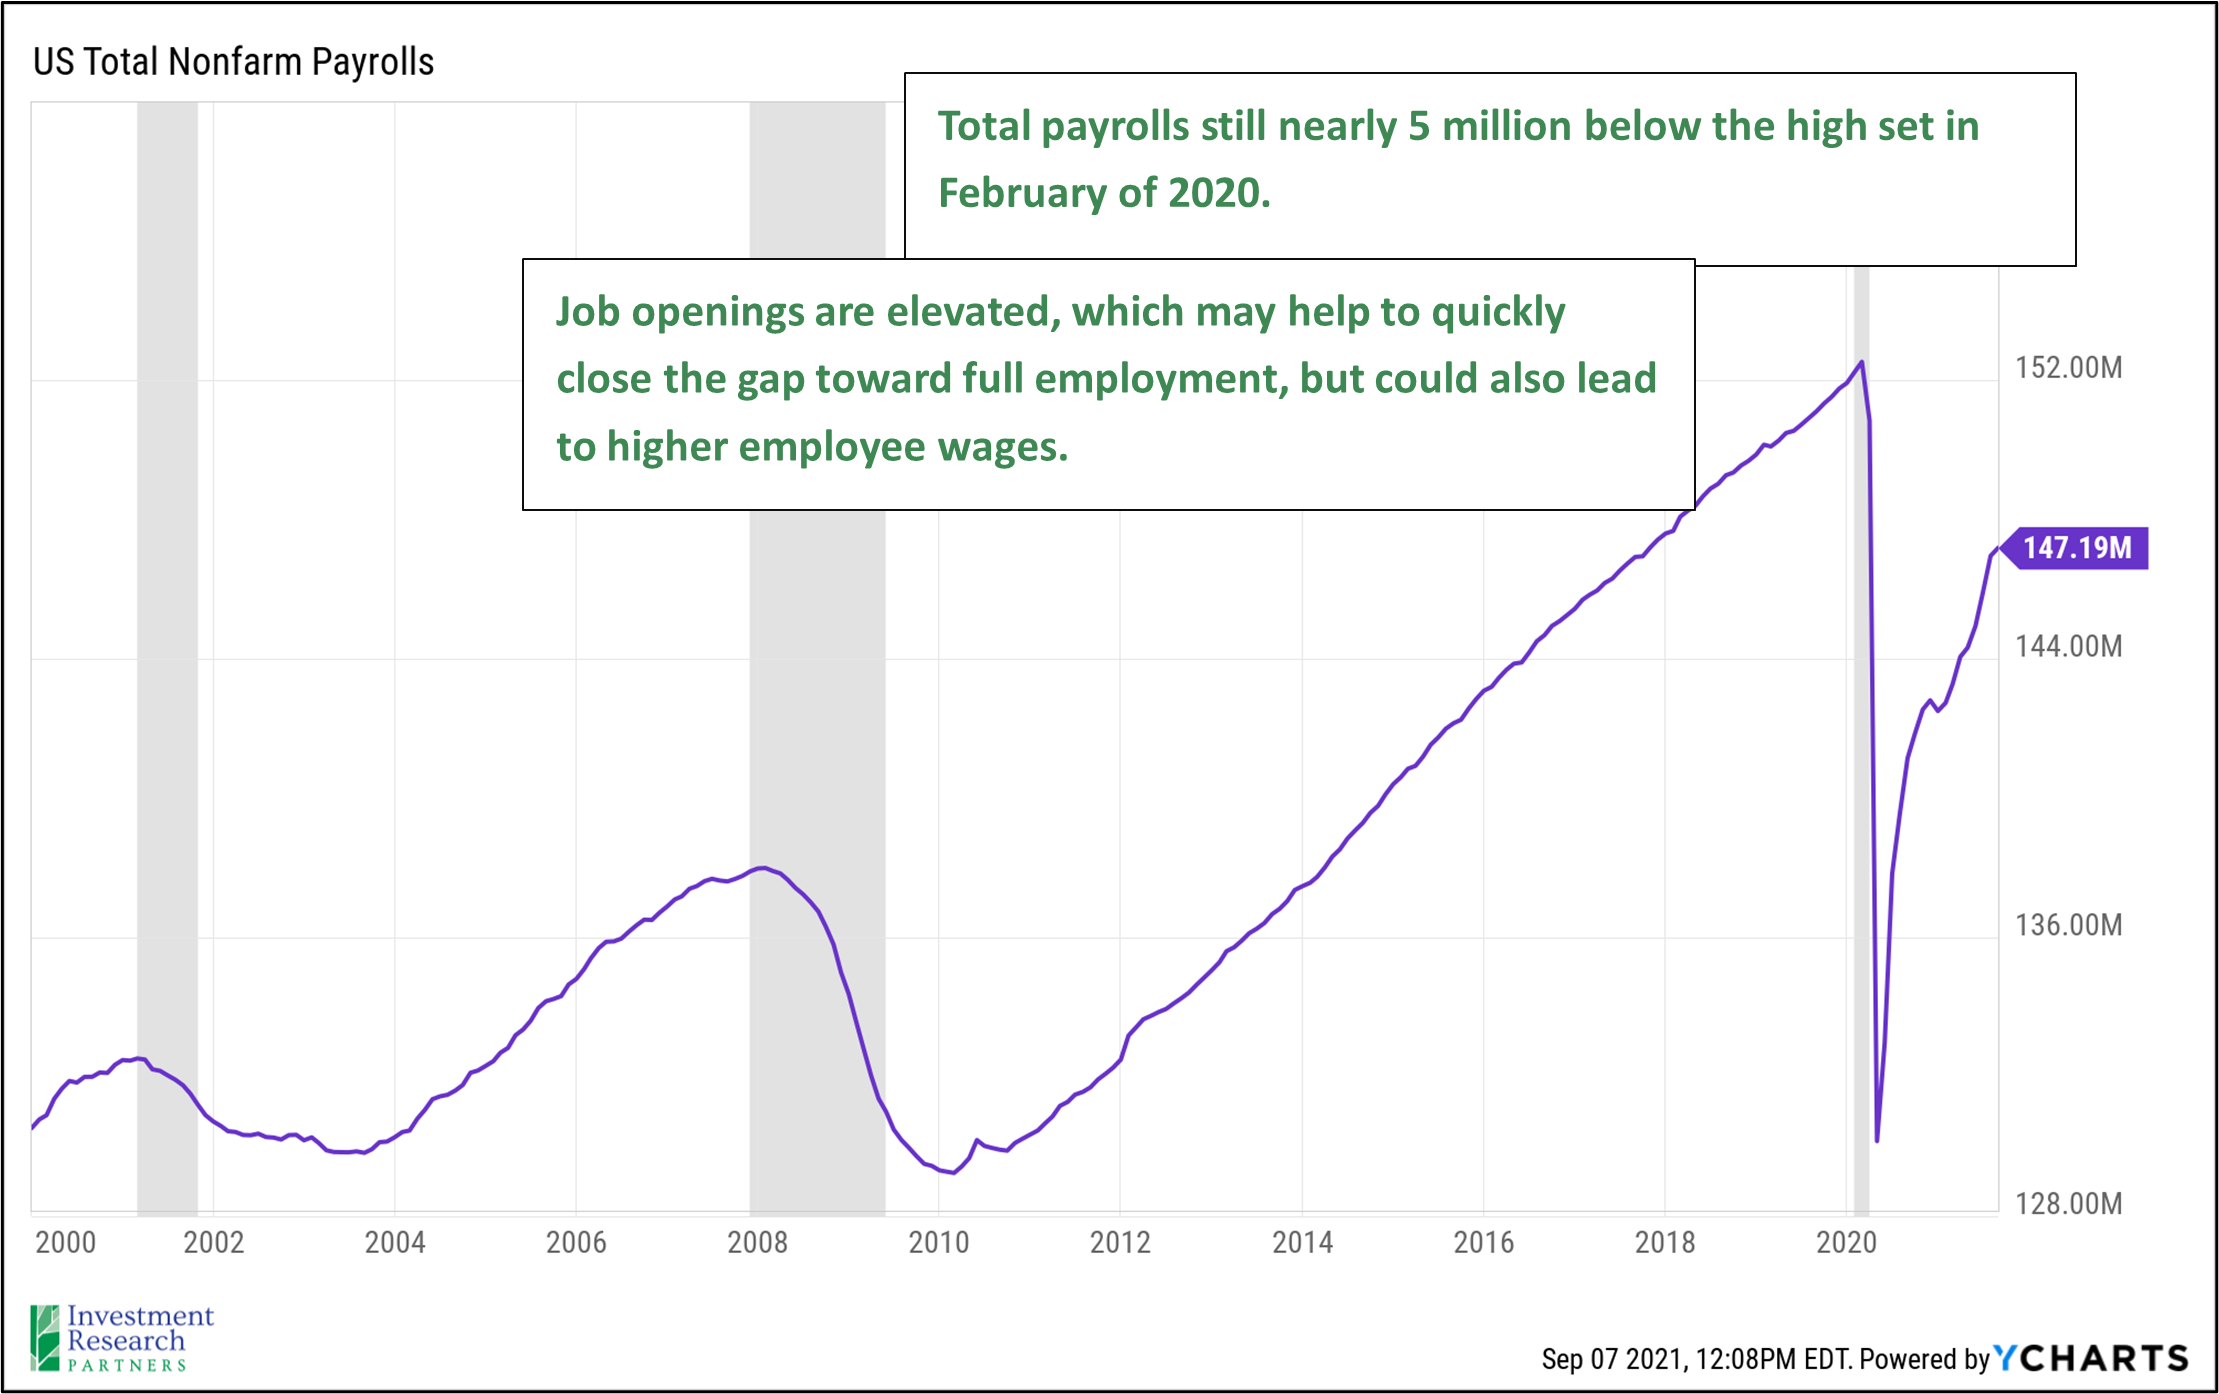
The US economy remains on a path for growth. The Conference Board Leading Economic Indicator Composite (pictured below in blue), which seeks to track data that has historically been predictive of future economic growth such as trends in the labor market, manufacturing, and financial conditions, remains in an upward trend. The labor market continues to improve, and job openings are plentiful. Total US nonfarm payrolls remain approximately 5 million below the all-time high set in February 2020 just before the pandemic. The US Federal Reserve has communicated that they will look for employment to recover to that level before beginning to raise interest rates, though if inflation significantly outpaces expectations, the central bank may be forced to raise interest rates sooner.
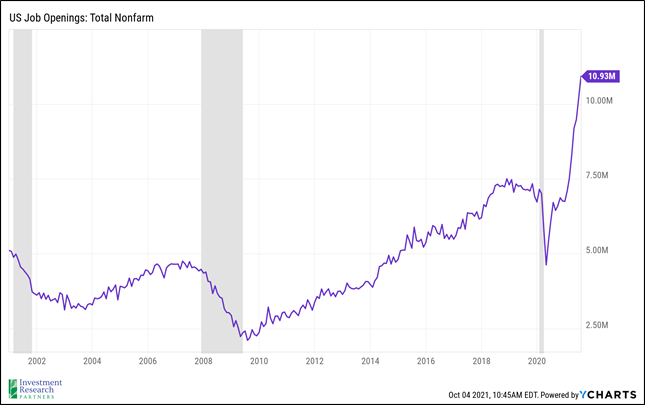
Given the robust pace of economic growth during the reopening of 2021, it would not be surprising to see the path toward closing the gap to full employment occur faster than during previous economic recoveries, particularly given the elevated number of job openings (see third chart below). It appears that those in our economy providing labor have an advantage today, so it would not be surprising to see continued wage gains over the next several quarters. It will be important to track if company revenues and earnings can continue to grow in order to digest higher labor costs.
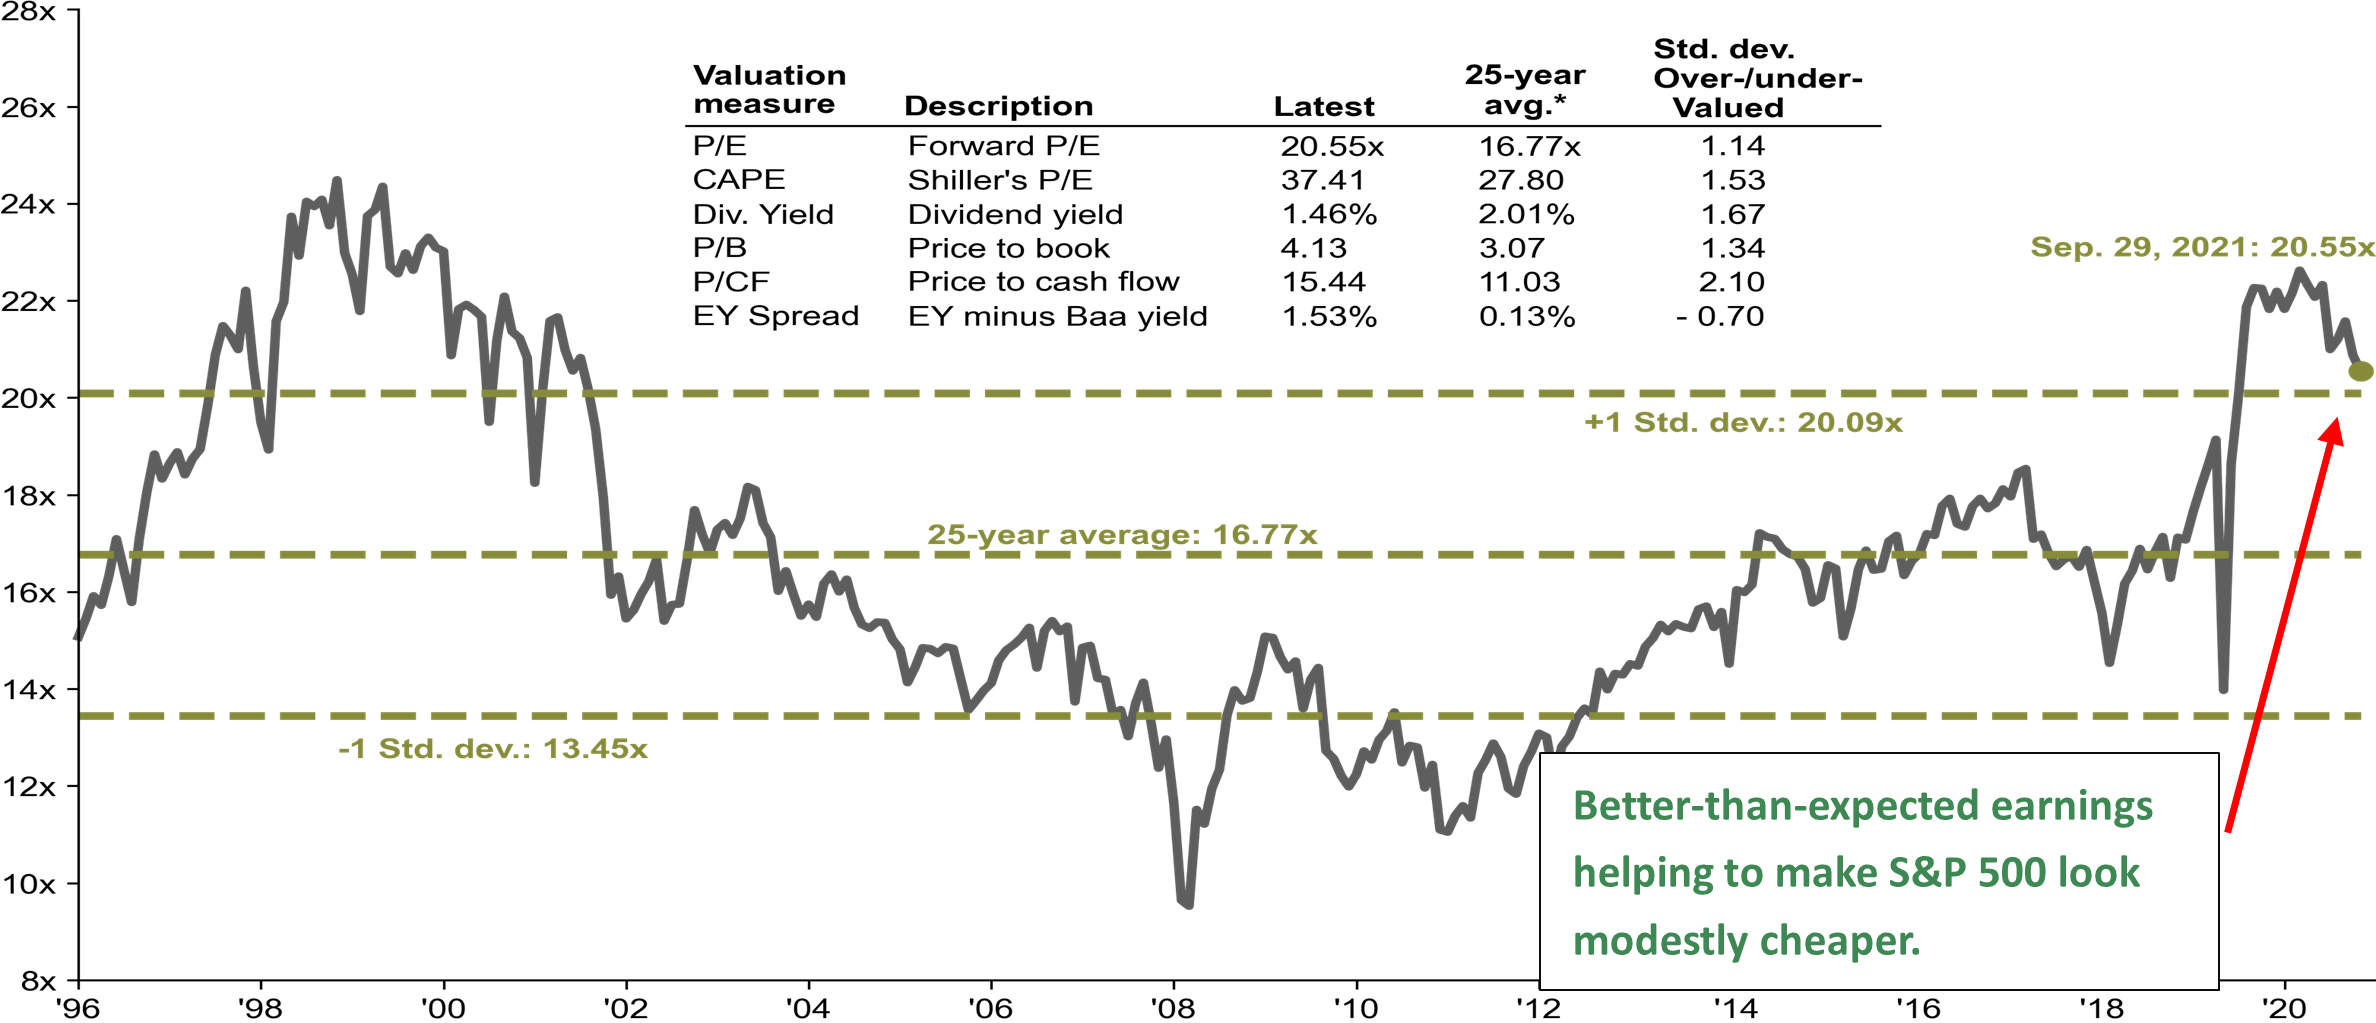
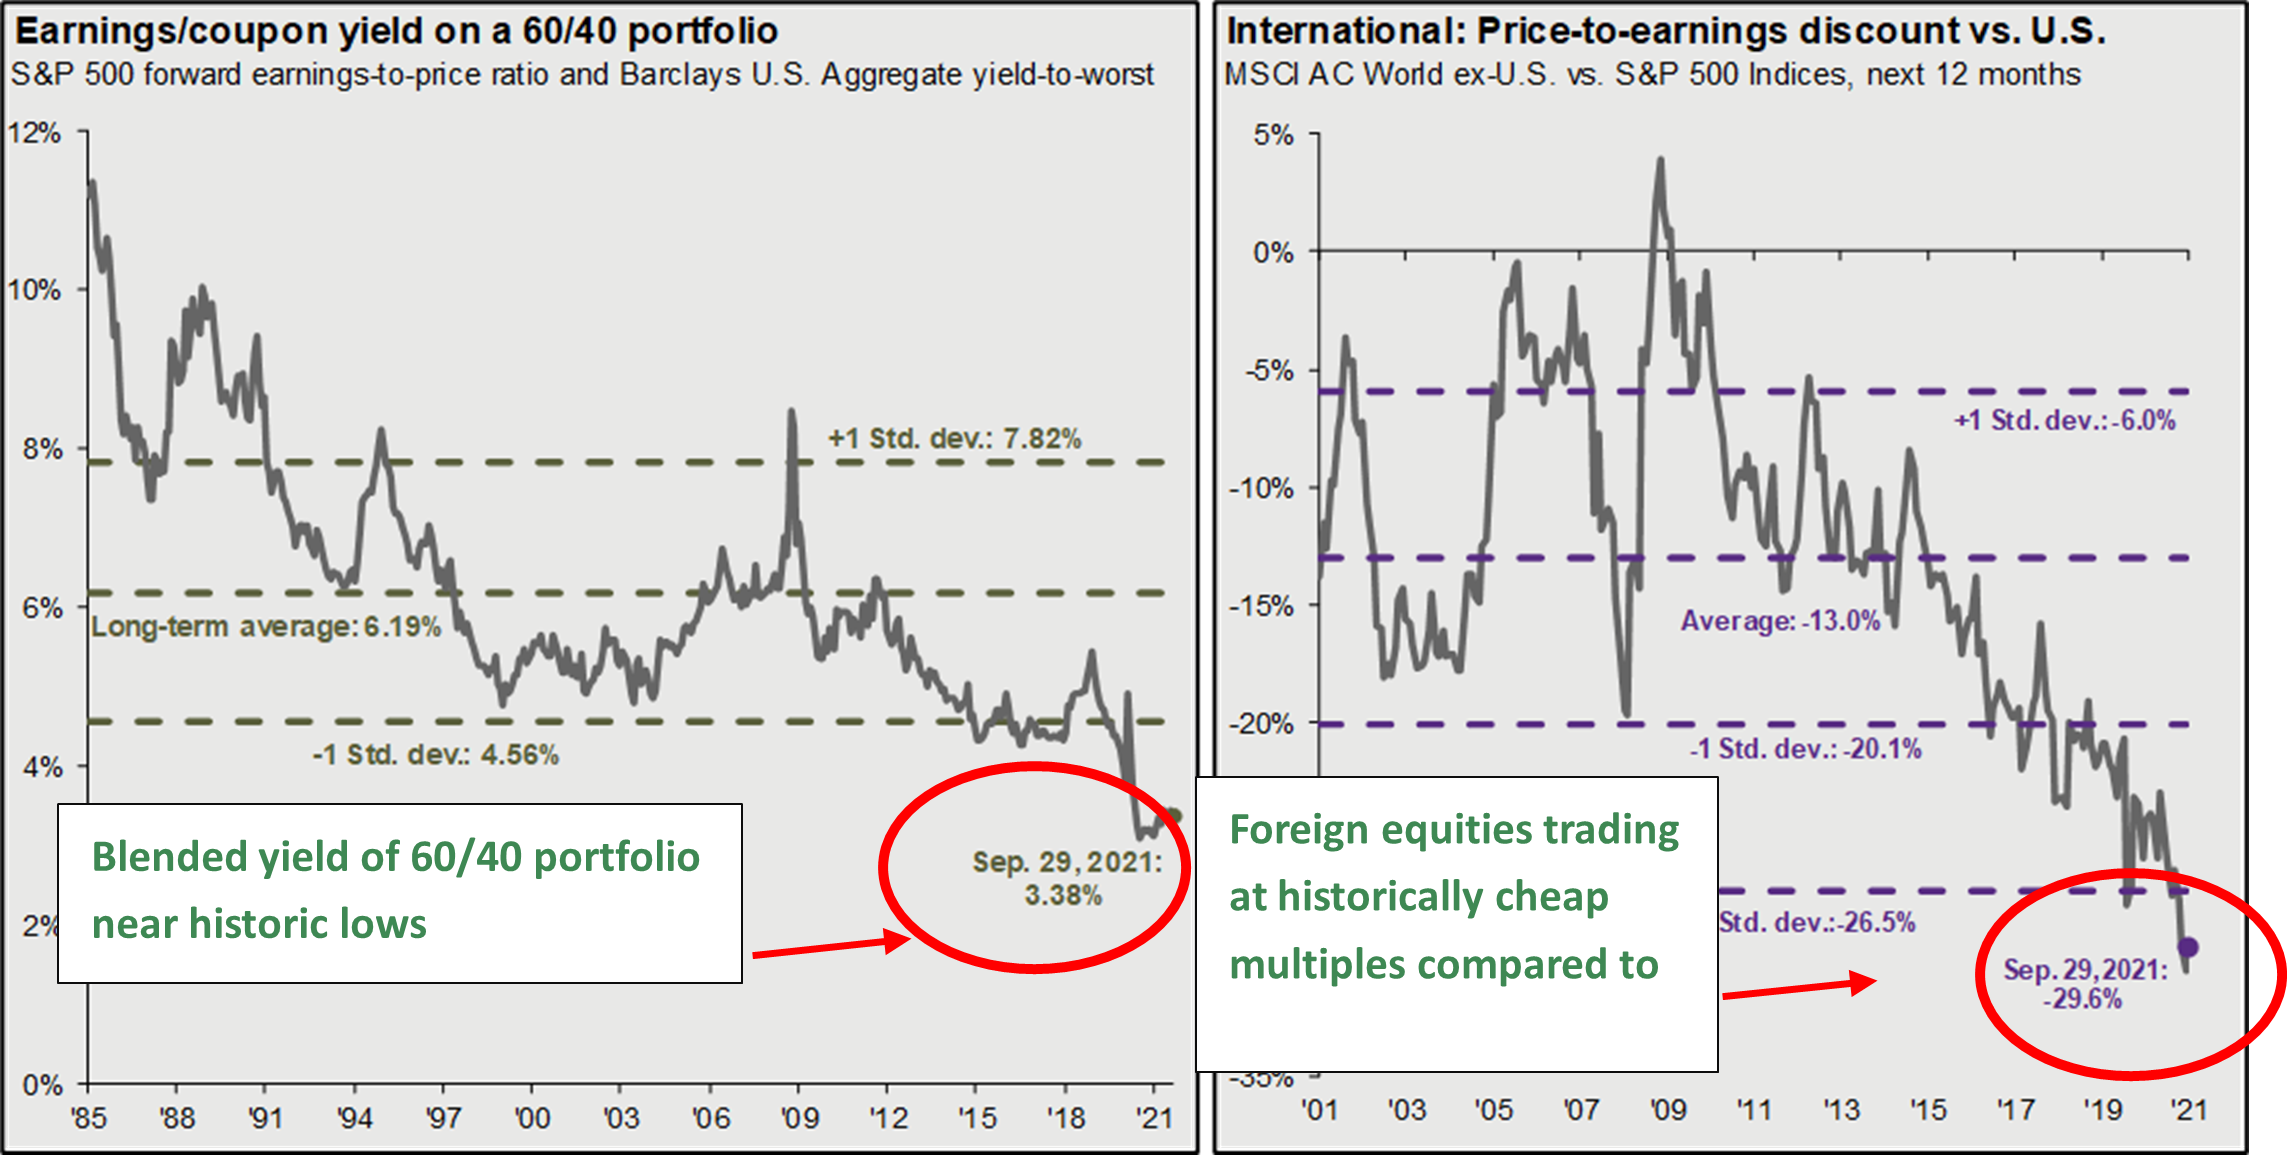
As corporate earnings have beaten expectations in 2021, the price-to-expected earnings multiple of the S&P 500 index has trended back down toward a more normal range for the last few months (first chart). However, the blended yield of a 60% S&P 500 / 40% Barclays US Aggregate Bond portfolio is near all-time lows (second chart). Investors may need to look beyond traditional US stocks and bonds in order to increase expected portfolio return. For example, the third chart below exhibits the near-record price difference between the S&P 500 and foreign equities, which now trade at more than a 30% discount to large cap US stocks.
Asset Class Returns
| Category | Representative Index | Sept. 2021 | YTD 2021 | Full Year 2020 |
|---|---|---|---|---|
| Global Equity | MSCI All-Country | -4.1% | 11.1% | 16.3% |
| US Large Cap Equity | S&P 500 | -4.7% | 15.9% | 18.4% |
| US Small Cap Equity | Russell 2000 | -3.0% | 12.4% | 20.0% |
| Foreign Developed Equity | MSCI EAFE | -2.9% | 8.4% | 7.8% |
| Emerging Market Equity | MSCI Emerging Markets | -1.3% | -4.0% | 18.3% |
| US High Yield Fixed Income | ICE BofAML High Yield | 0.0% | 4.7% | 6.2% |
| US Fixed Income | Barclays Aggregate Bond | -0.9% | -1.6% | 7.5% |
| Cash Equivalents | ICE BofAML 3 Mo Deposit | 0.0% | 0.0% | 0.5% |
| Source: Morningstar (total returns shown gross of fees) As of September 30, 2021 |
Prices & Interest Rates
| Representative Index | Sept. 30, 2021 | Year-End 2020 |
|---|---|---|
| S&P 500 | 4,308 | 3,756 |
| Dow Jones Industrial Avg. | 33,844 | 30,606 |
| NASDAQ | 14,449 | 12,888 |
| Crude Oil (US WTI) | $75.03 | $48.42 |
| Gold | $1,756 | $1,902 |
| US Dollar | 94.23 | 89.94 |
| 2 Year Treasury | 0.28% | 0.13% |
| 10 Year Treasury | 1.48% | 0.93% |
| 30 Year Treasury | 2.04% | 1.65% |
| Source: Bloomberg, US Treasury (total returns shown gross of fees) As of September 30, 2021 |
Download PDF Version
Past performance may not be representative of future results. All investments are subject to loss. Forecasts regarding the market or economy are subject to a wide range of possible outcomes. The views presented in this market update may prove to be inaccurate for a variety of factors. These views are as of the date listed above and are subject to change based on changes in fundamental economic or market-related data. Please contact your Financial Advisor in order to complete an updated risk assessment to ensure that your investment allocation is appropriate.