


May 6, 2022 •OneAscent

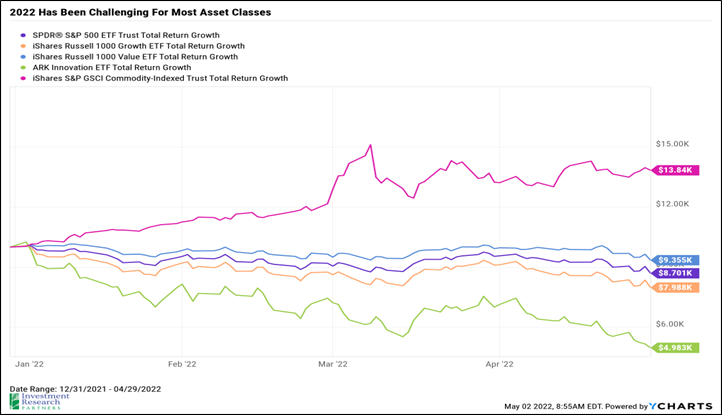
April was an abysmal month for most risk assets, with the S&P 500 index (large US companies) declining nearly 9 percent bringing year-to-date losses for the index to almost 13 percent. In addition, unique to 2022 relative to historic norms, bonds have not offered much shelter from losses. The Bloomberg Barclays US Aggregate Bond index has declined 9 percent in 2022 after losing nearly 4 percent in April alone. Investors have been focused on the same risks for most of the year, and many of these risks are related and continue to evolve together.
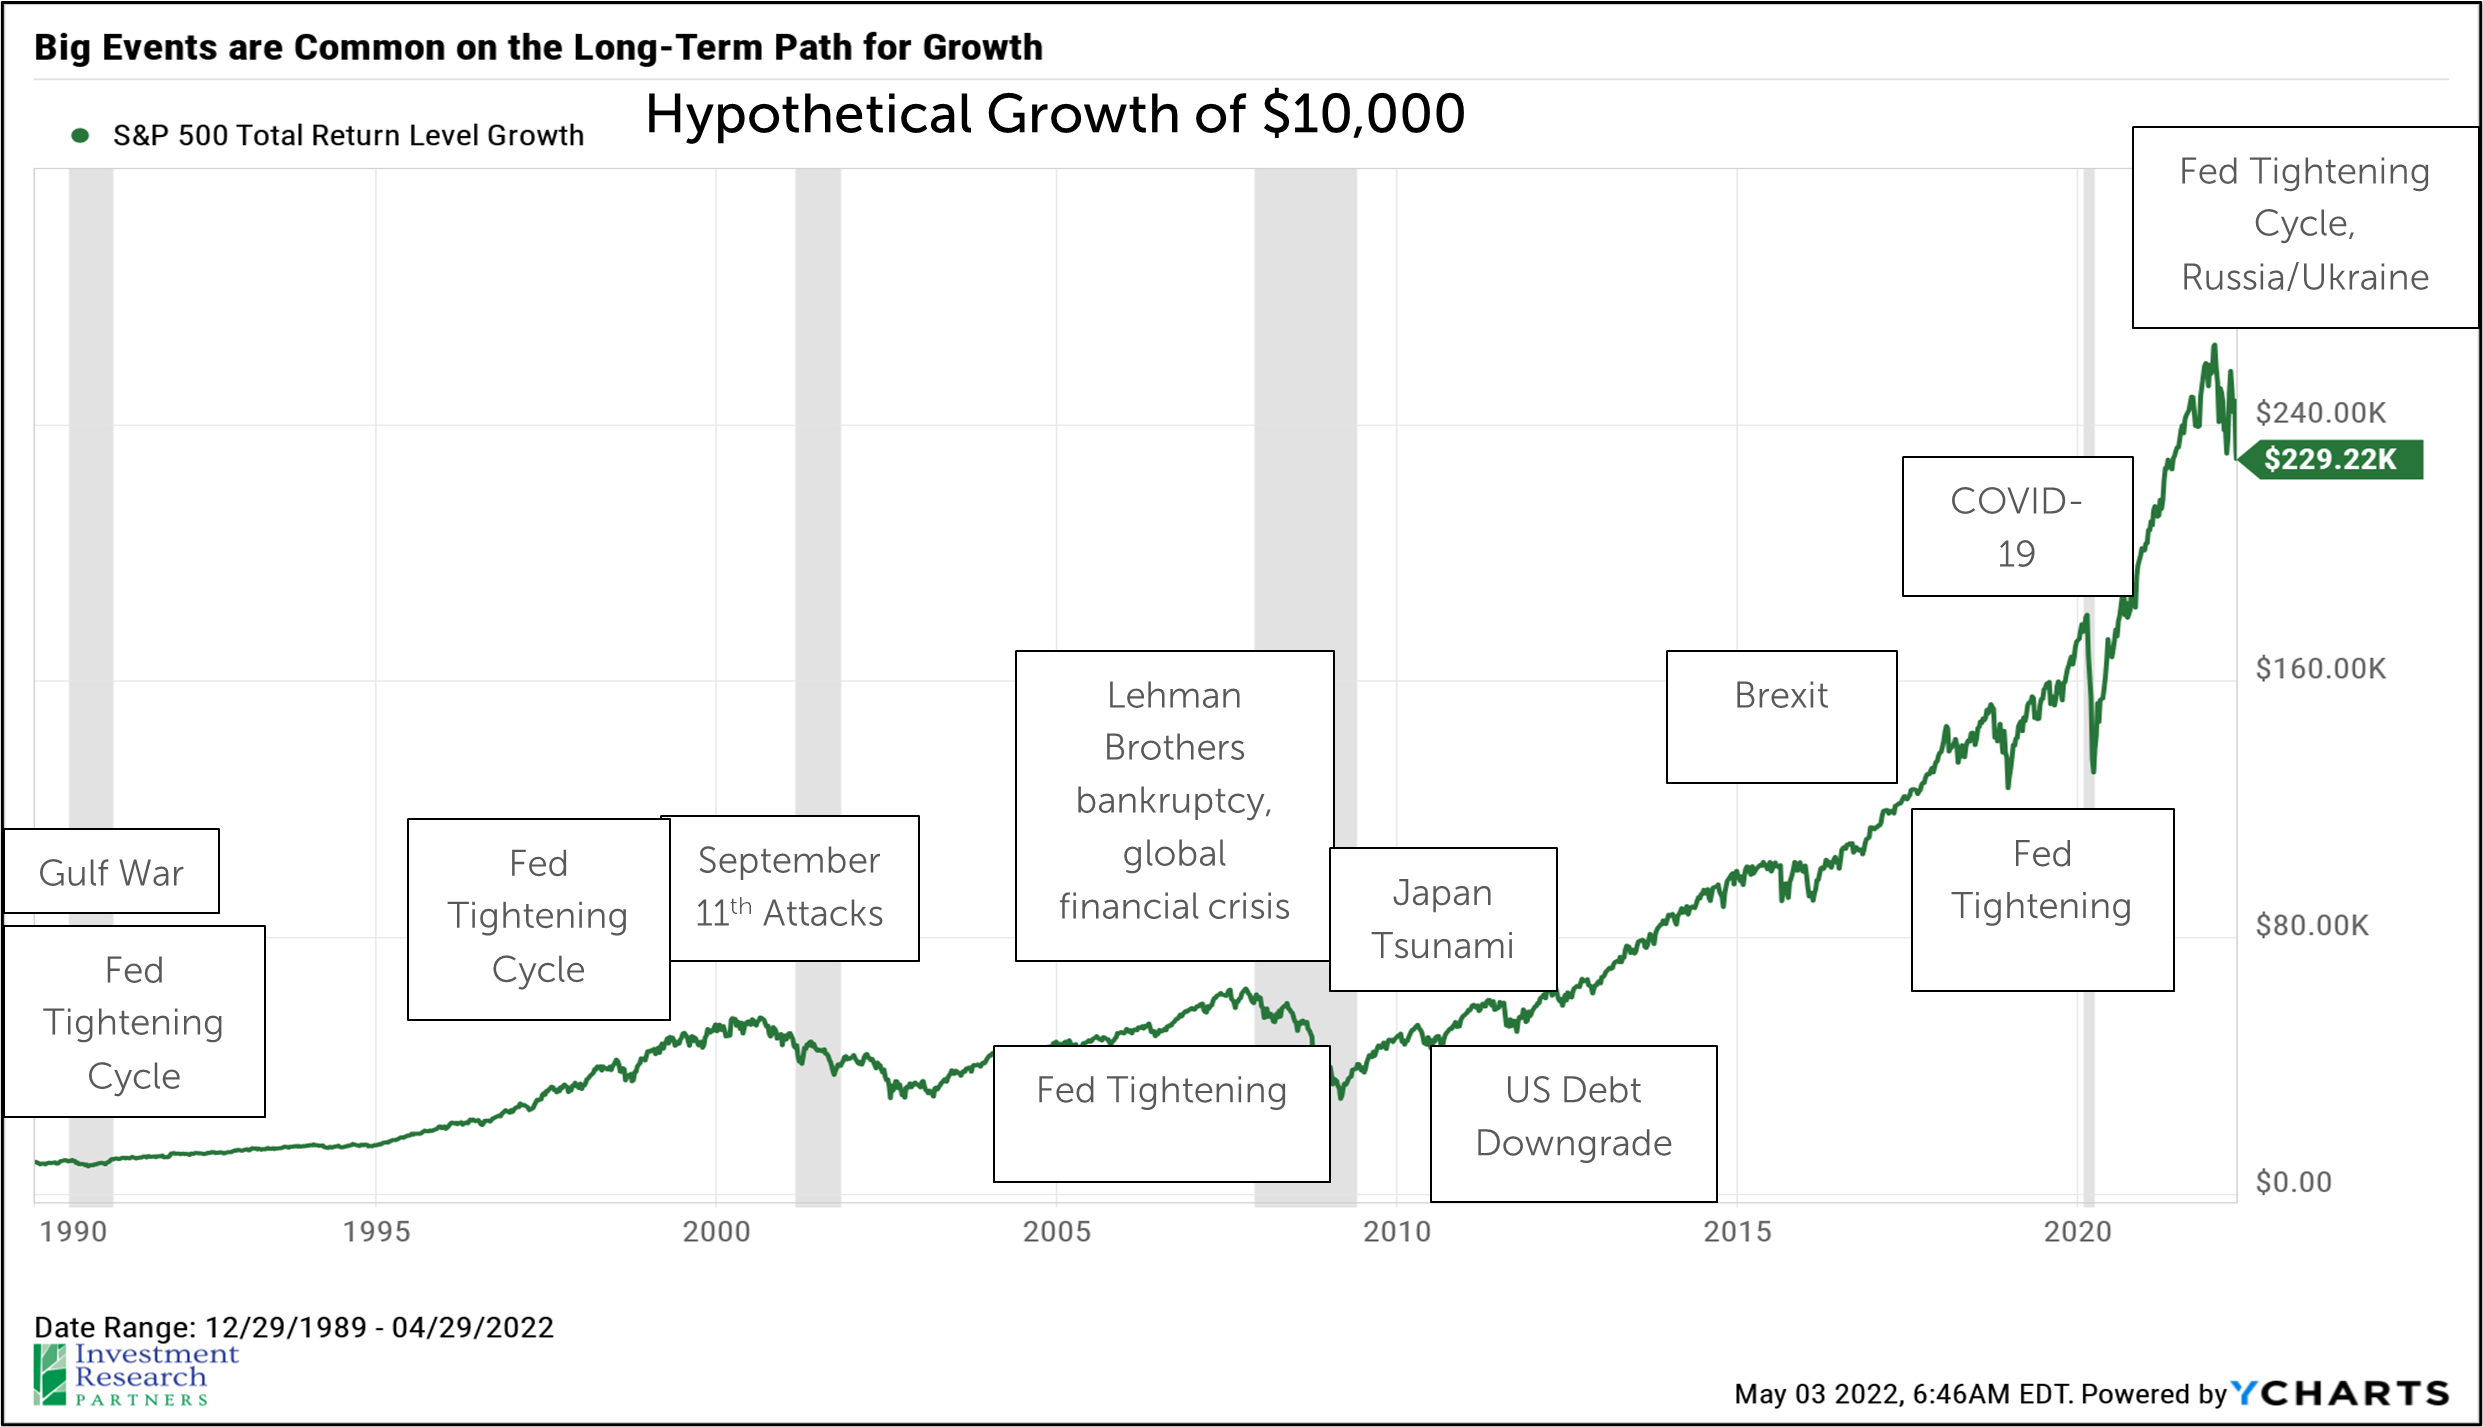
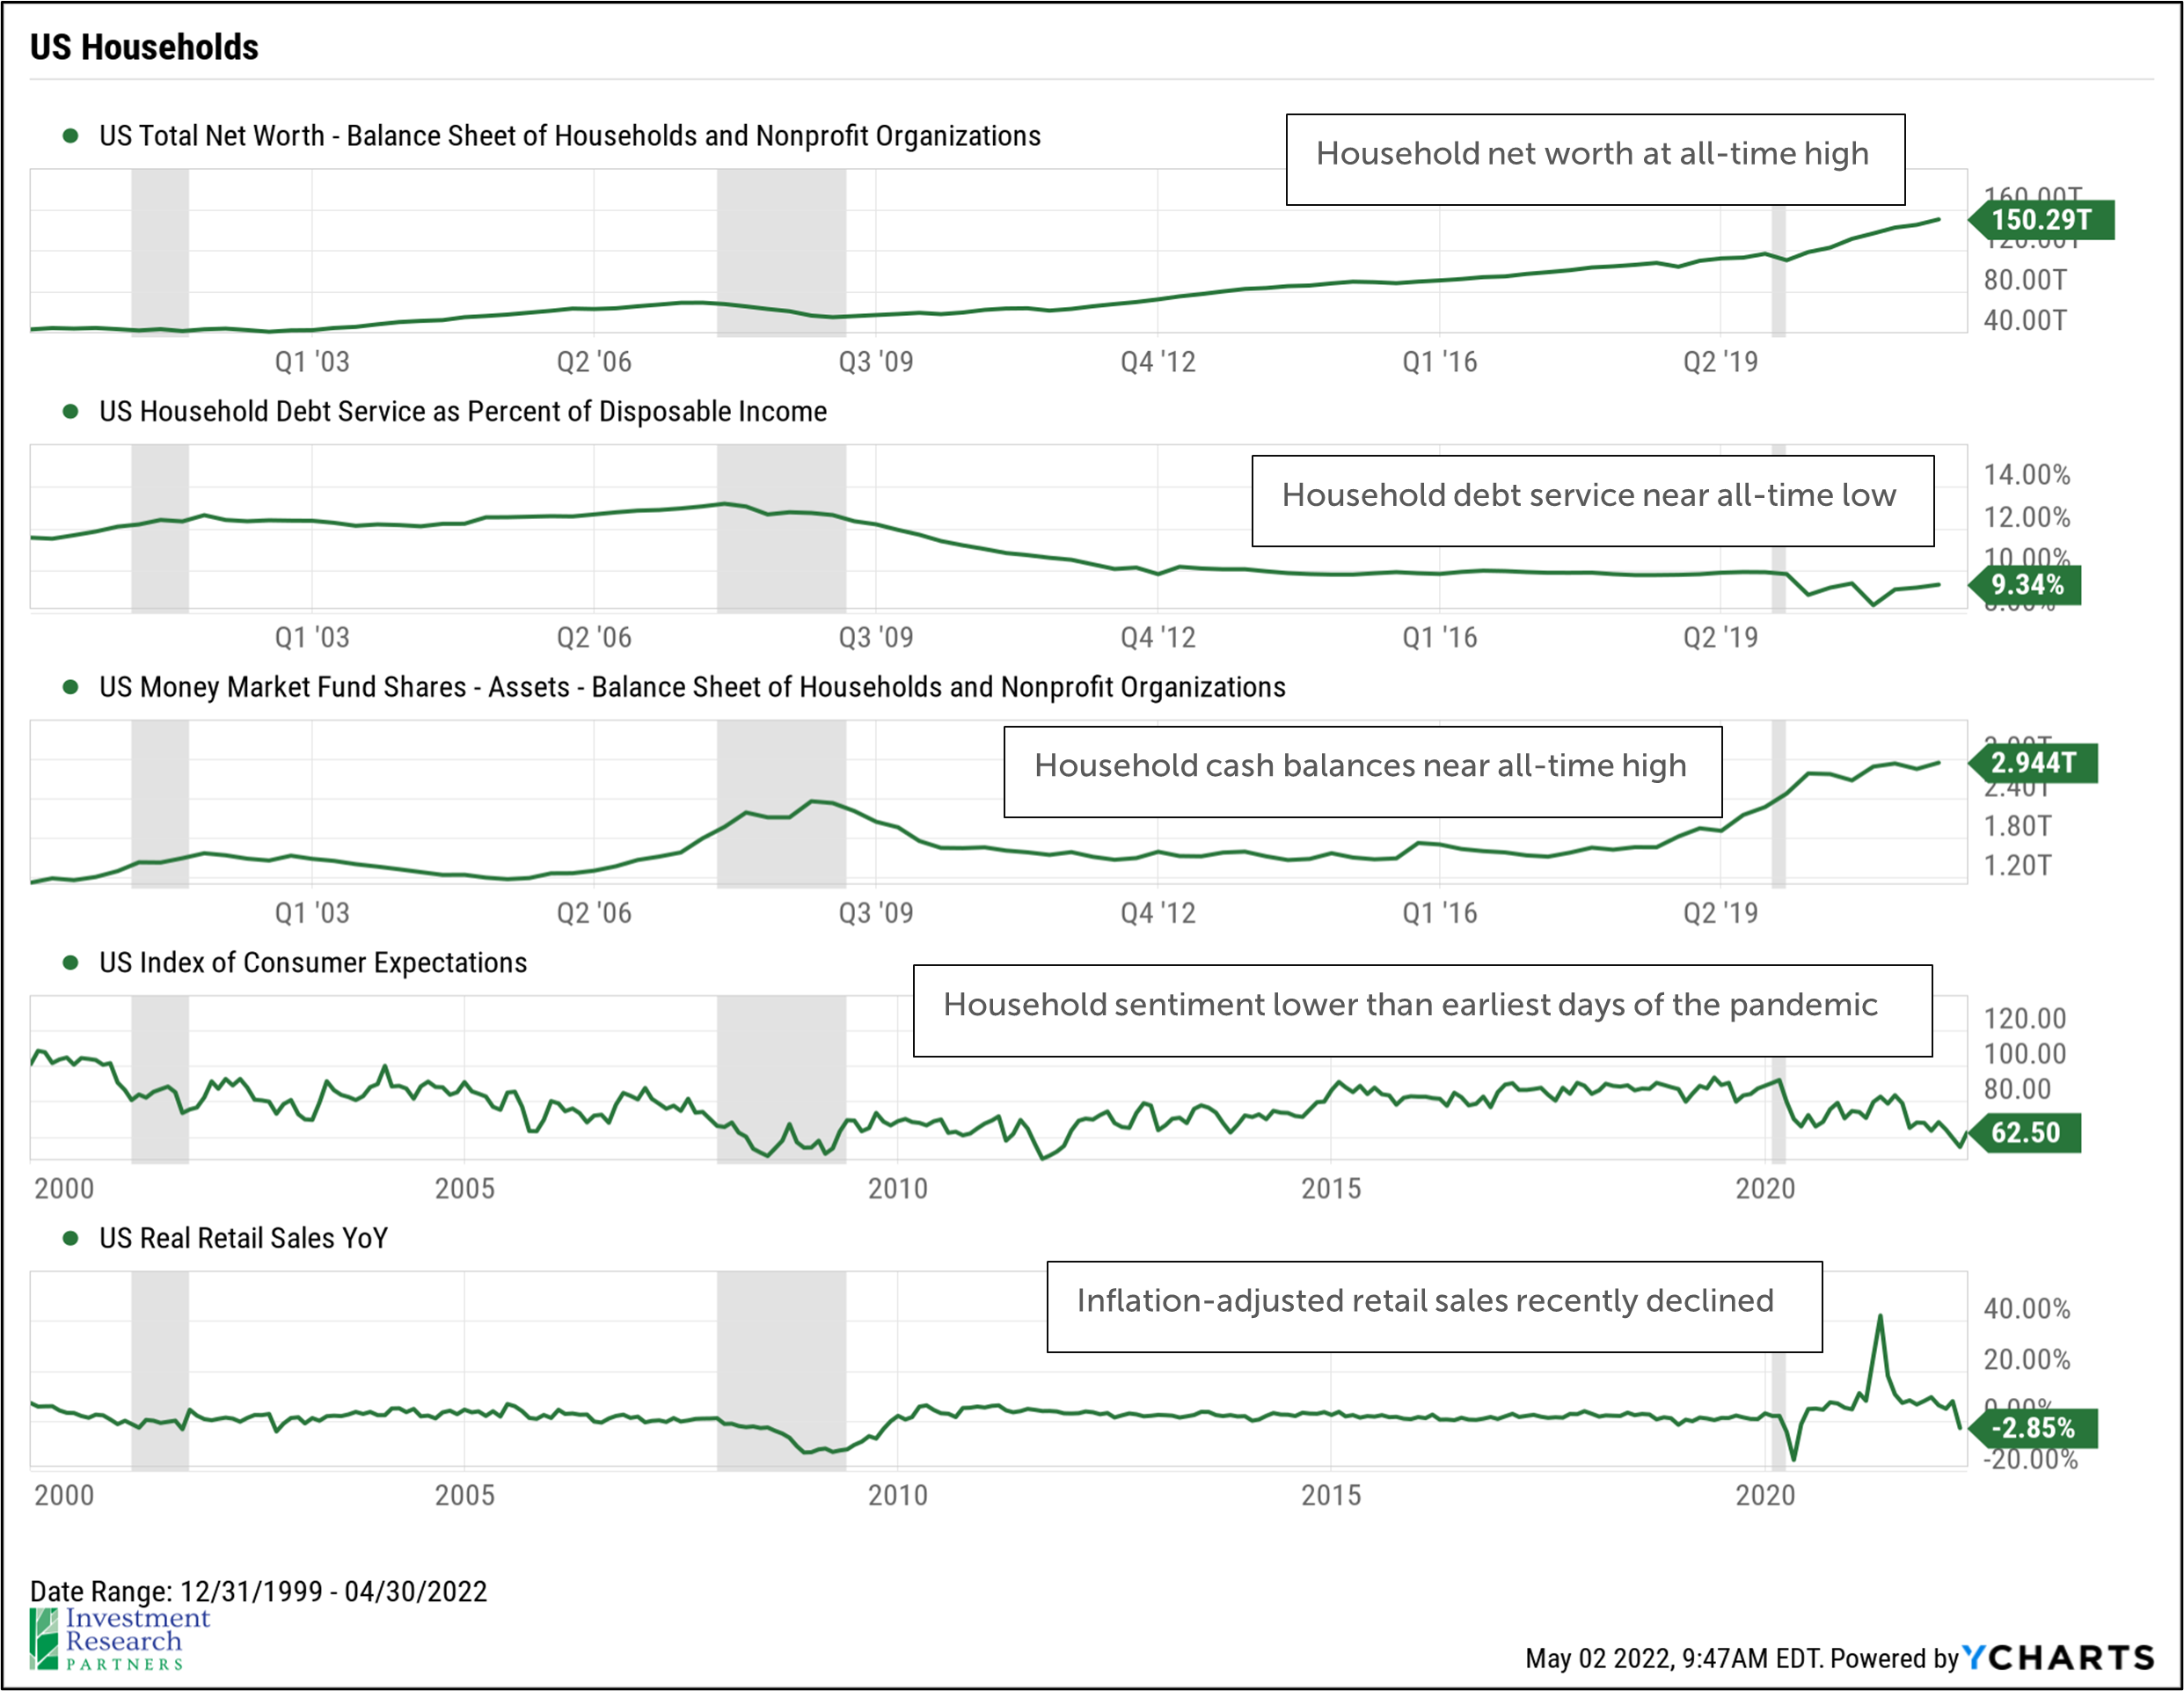
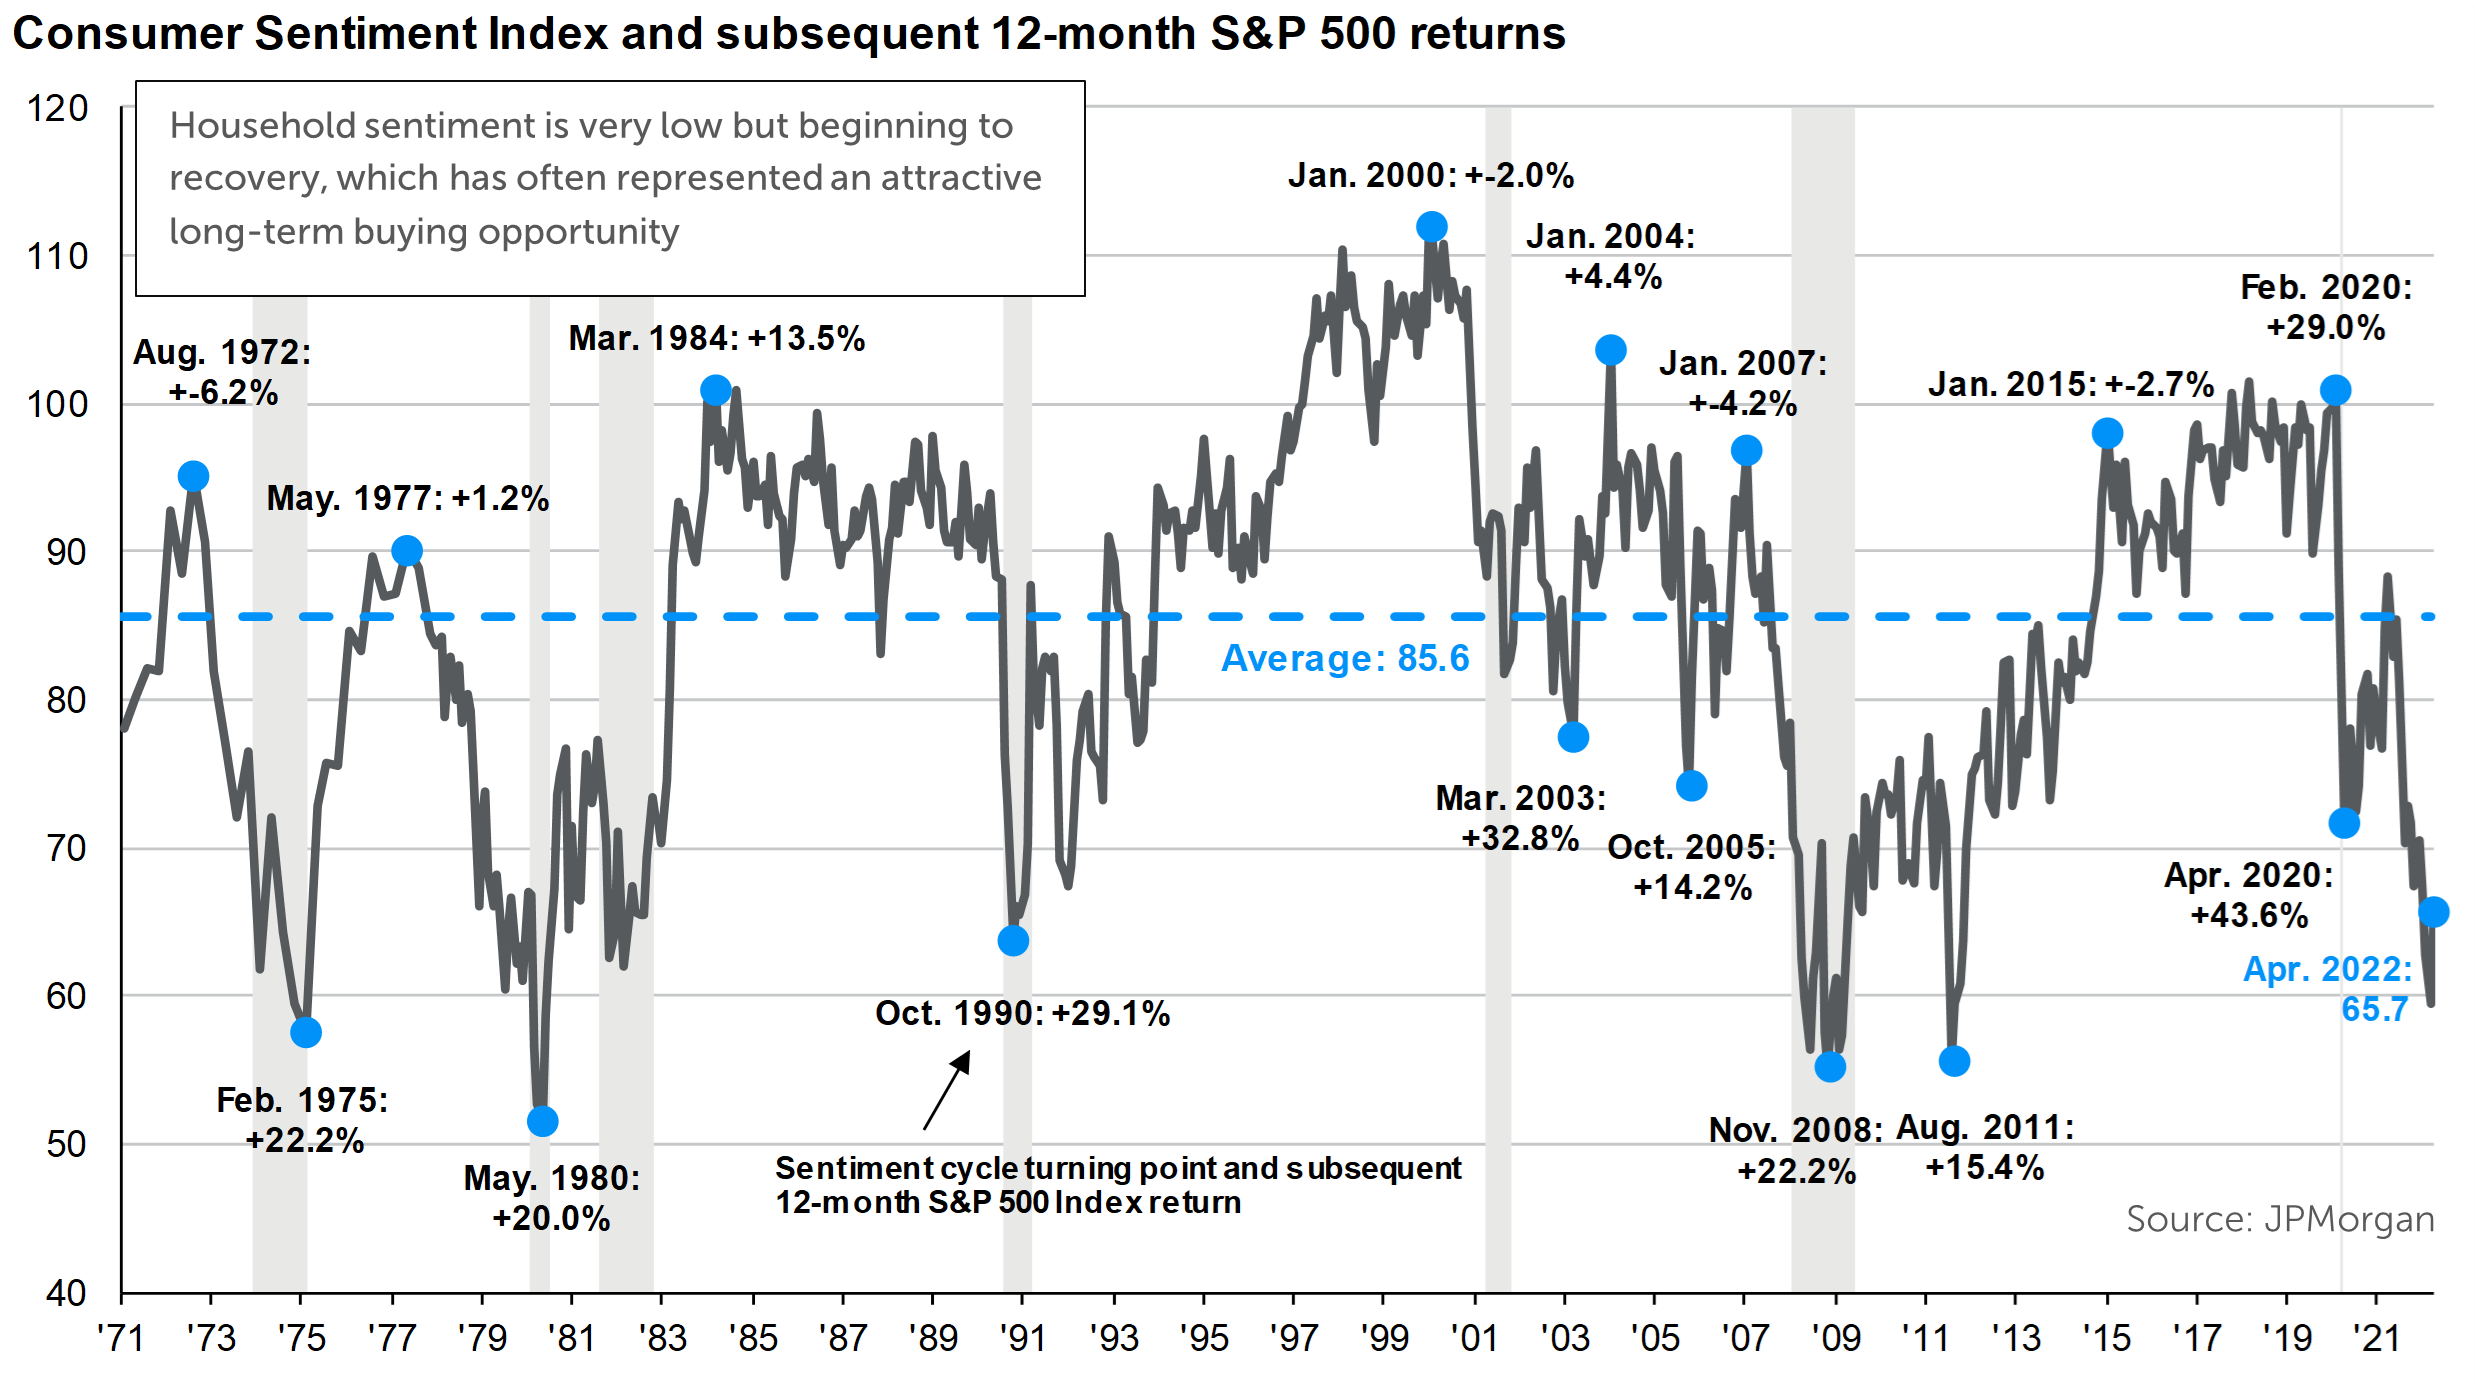
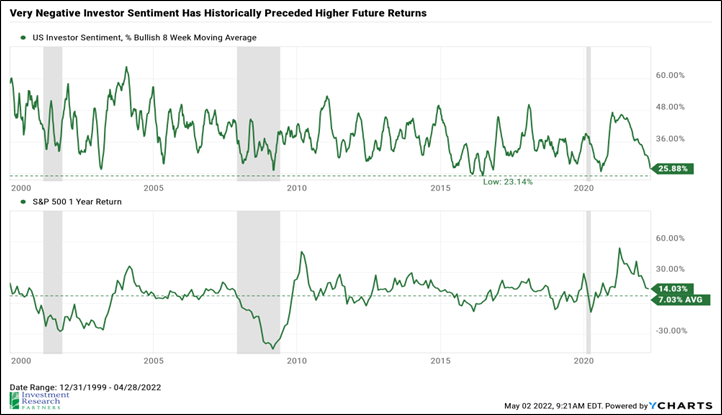
These risks are obviously daunting, but they are just as ubiquitous and widely discussed in financial media and investor letters like this one. Both household and investor sentiment have become very negative relative to long-term averages, a phenomena which have often foreshadowed higher future returns in equity markets. We believe that these risks and resulting market volatility have created attractive opportunities in specific securities and asset classes, perhaps the most salient point that we could offer investors today is simply to focus on your long-term investing goals and attempt to look beyond shorter-term fluctuations.
 |
|
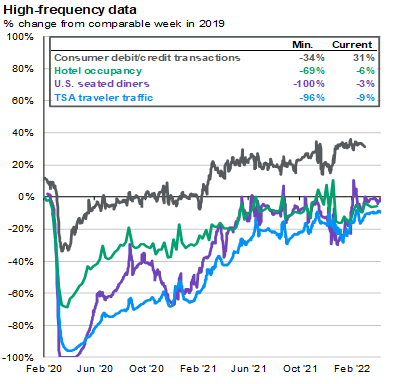 |
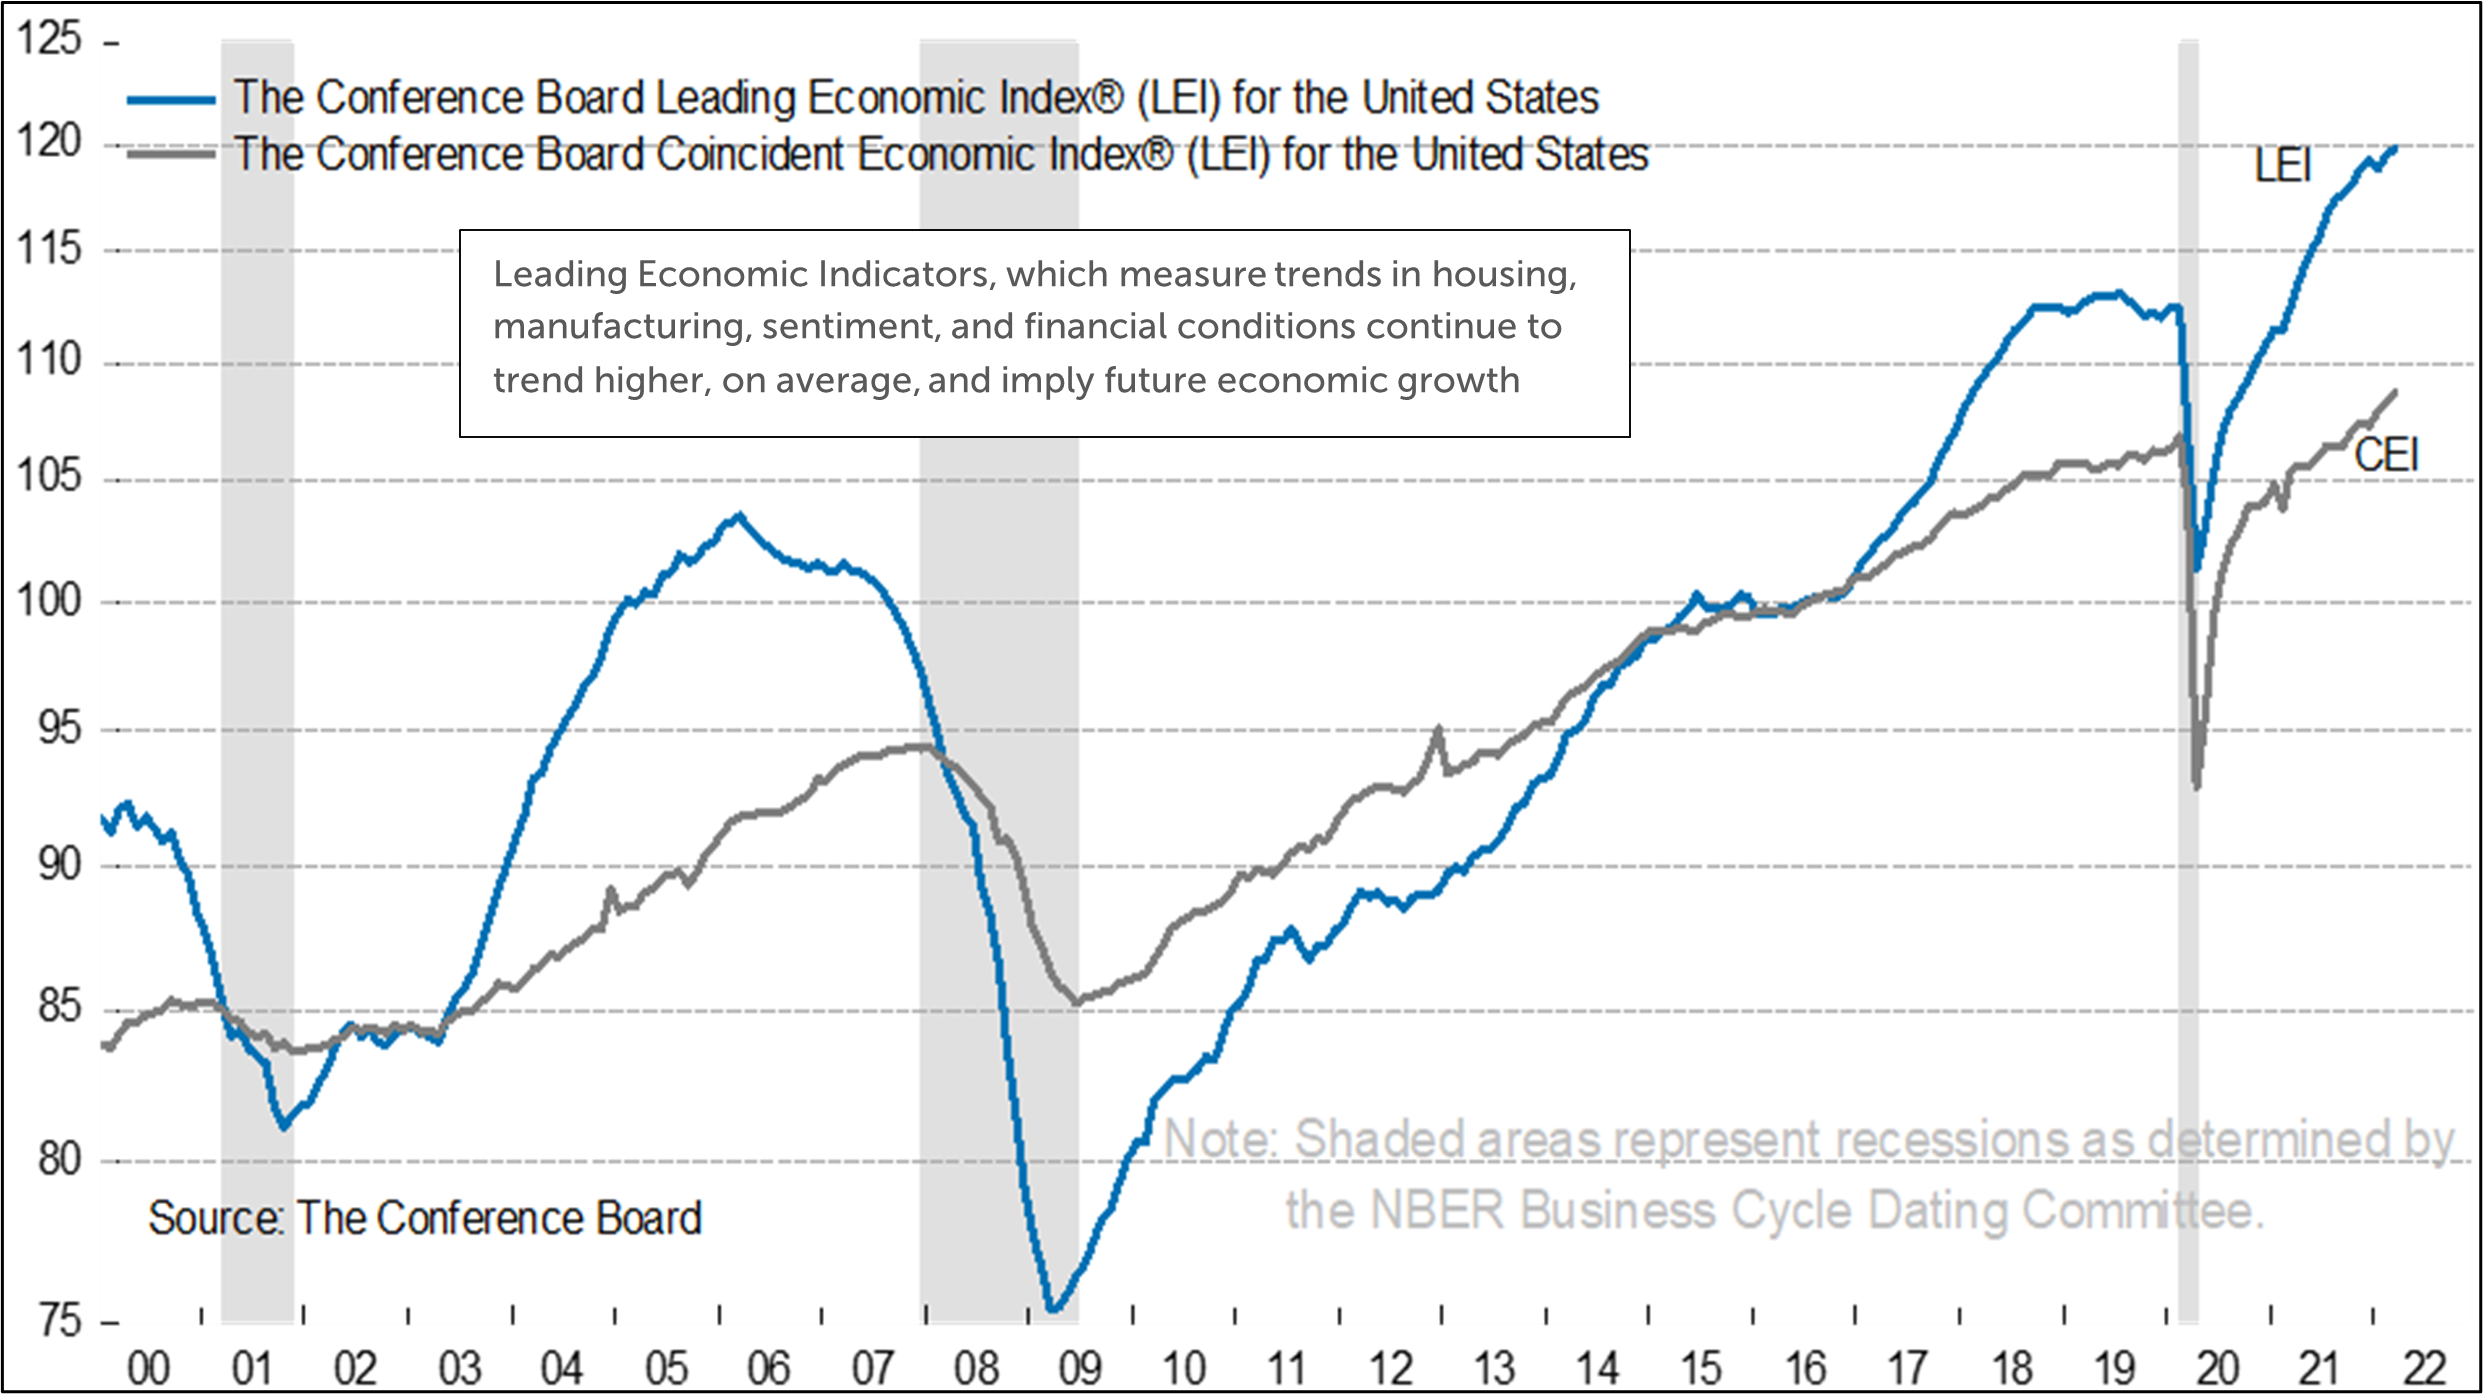
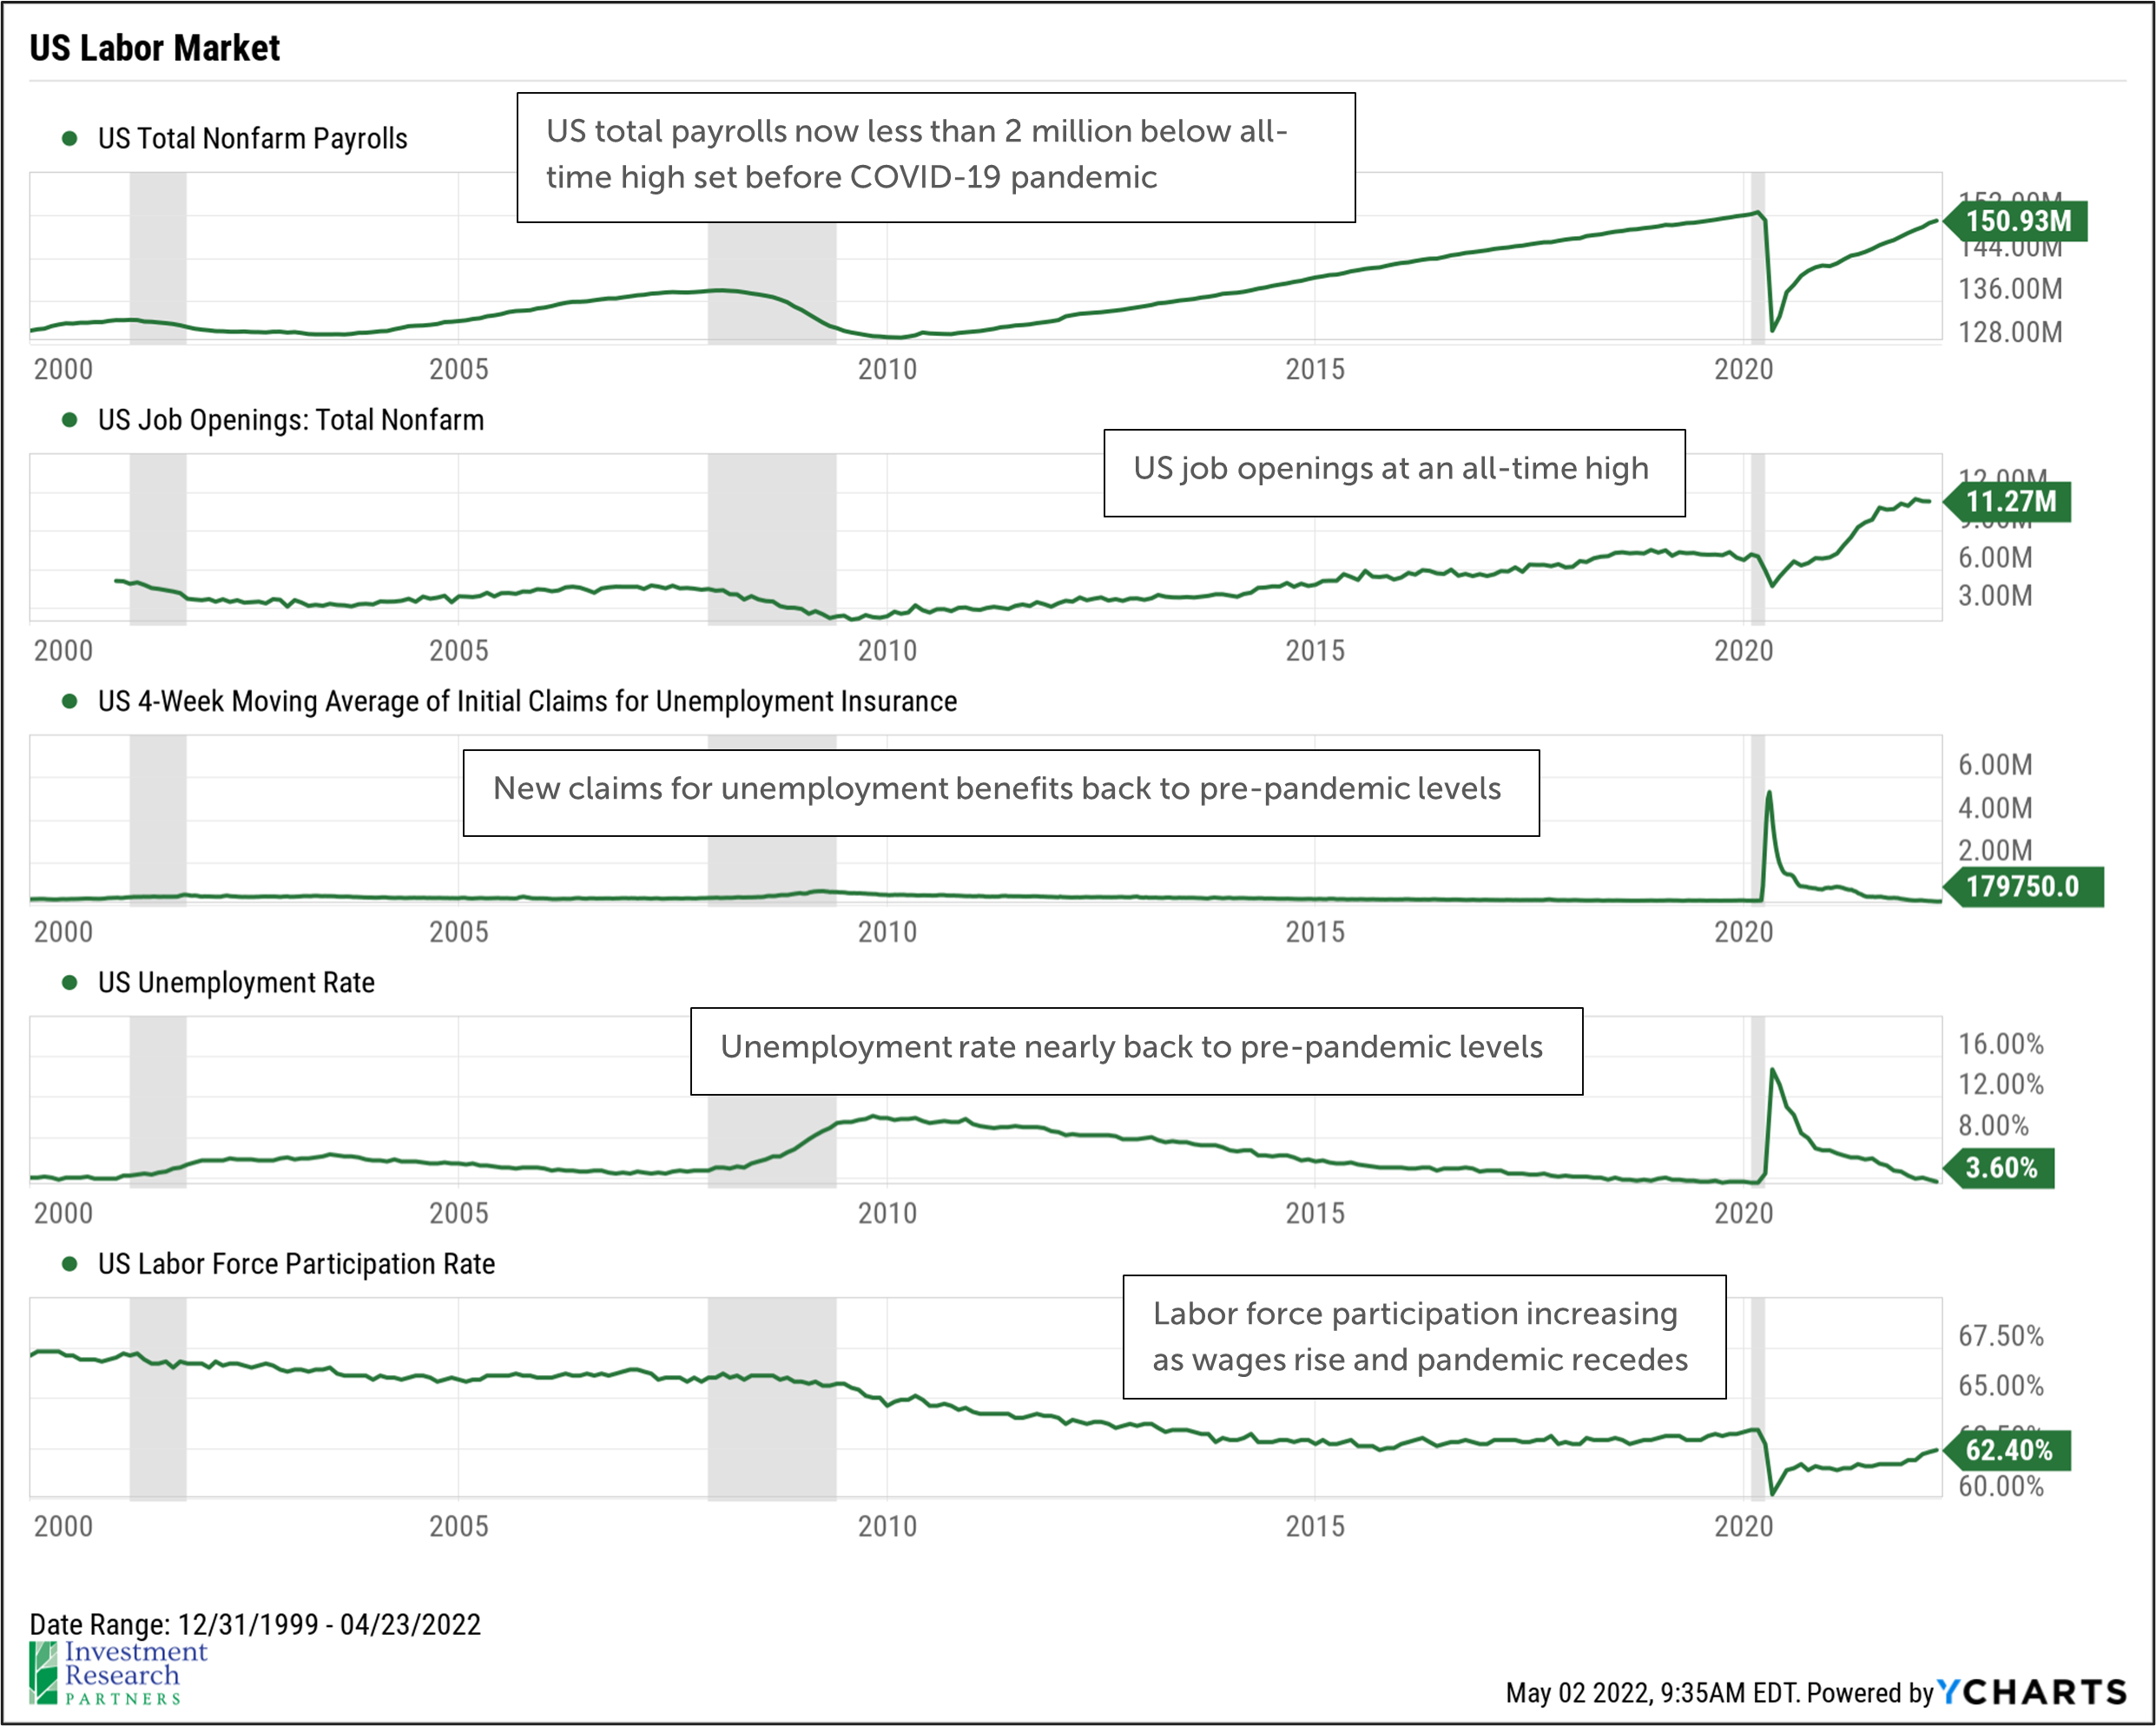
Household spending activity on credit card transactions, hotel occupancy, US seated diners, TSA traveler traffic are at or above pre-pandemic levels.
Source: JPMorgan
|
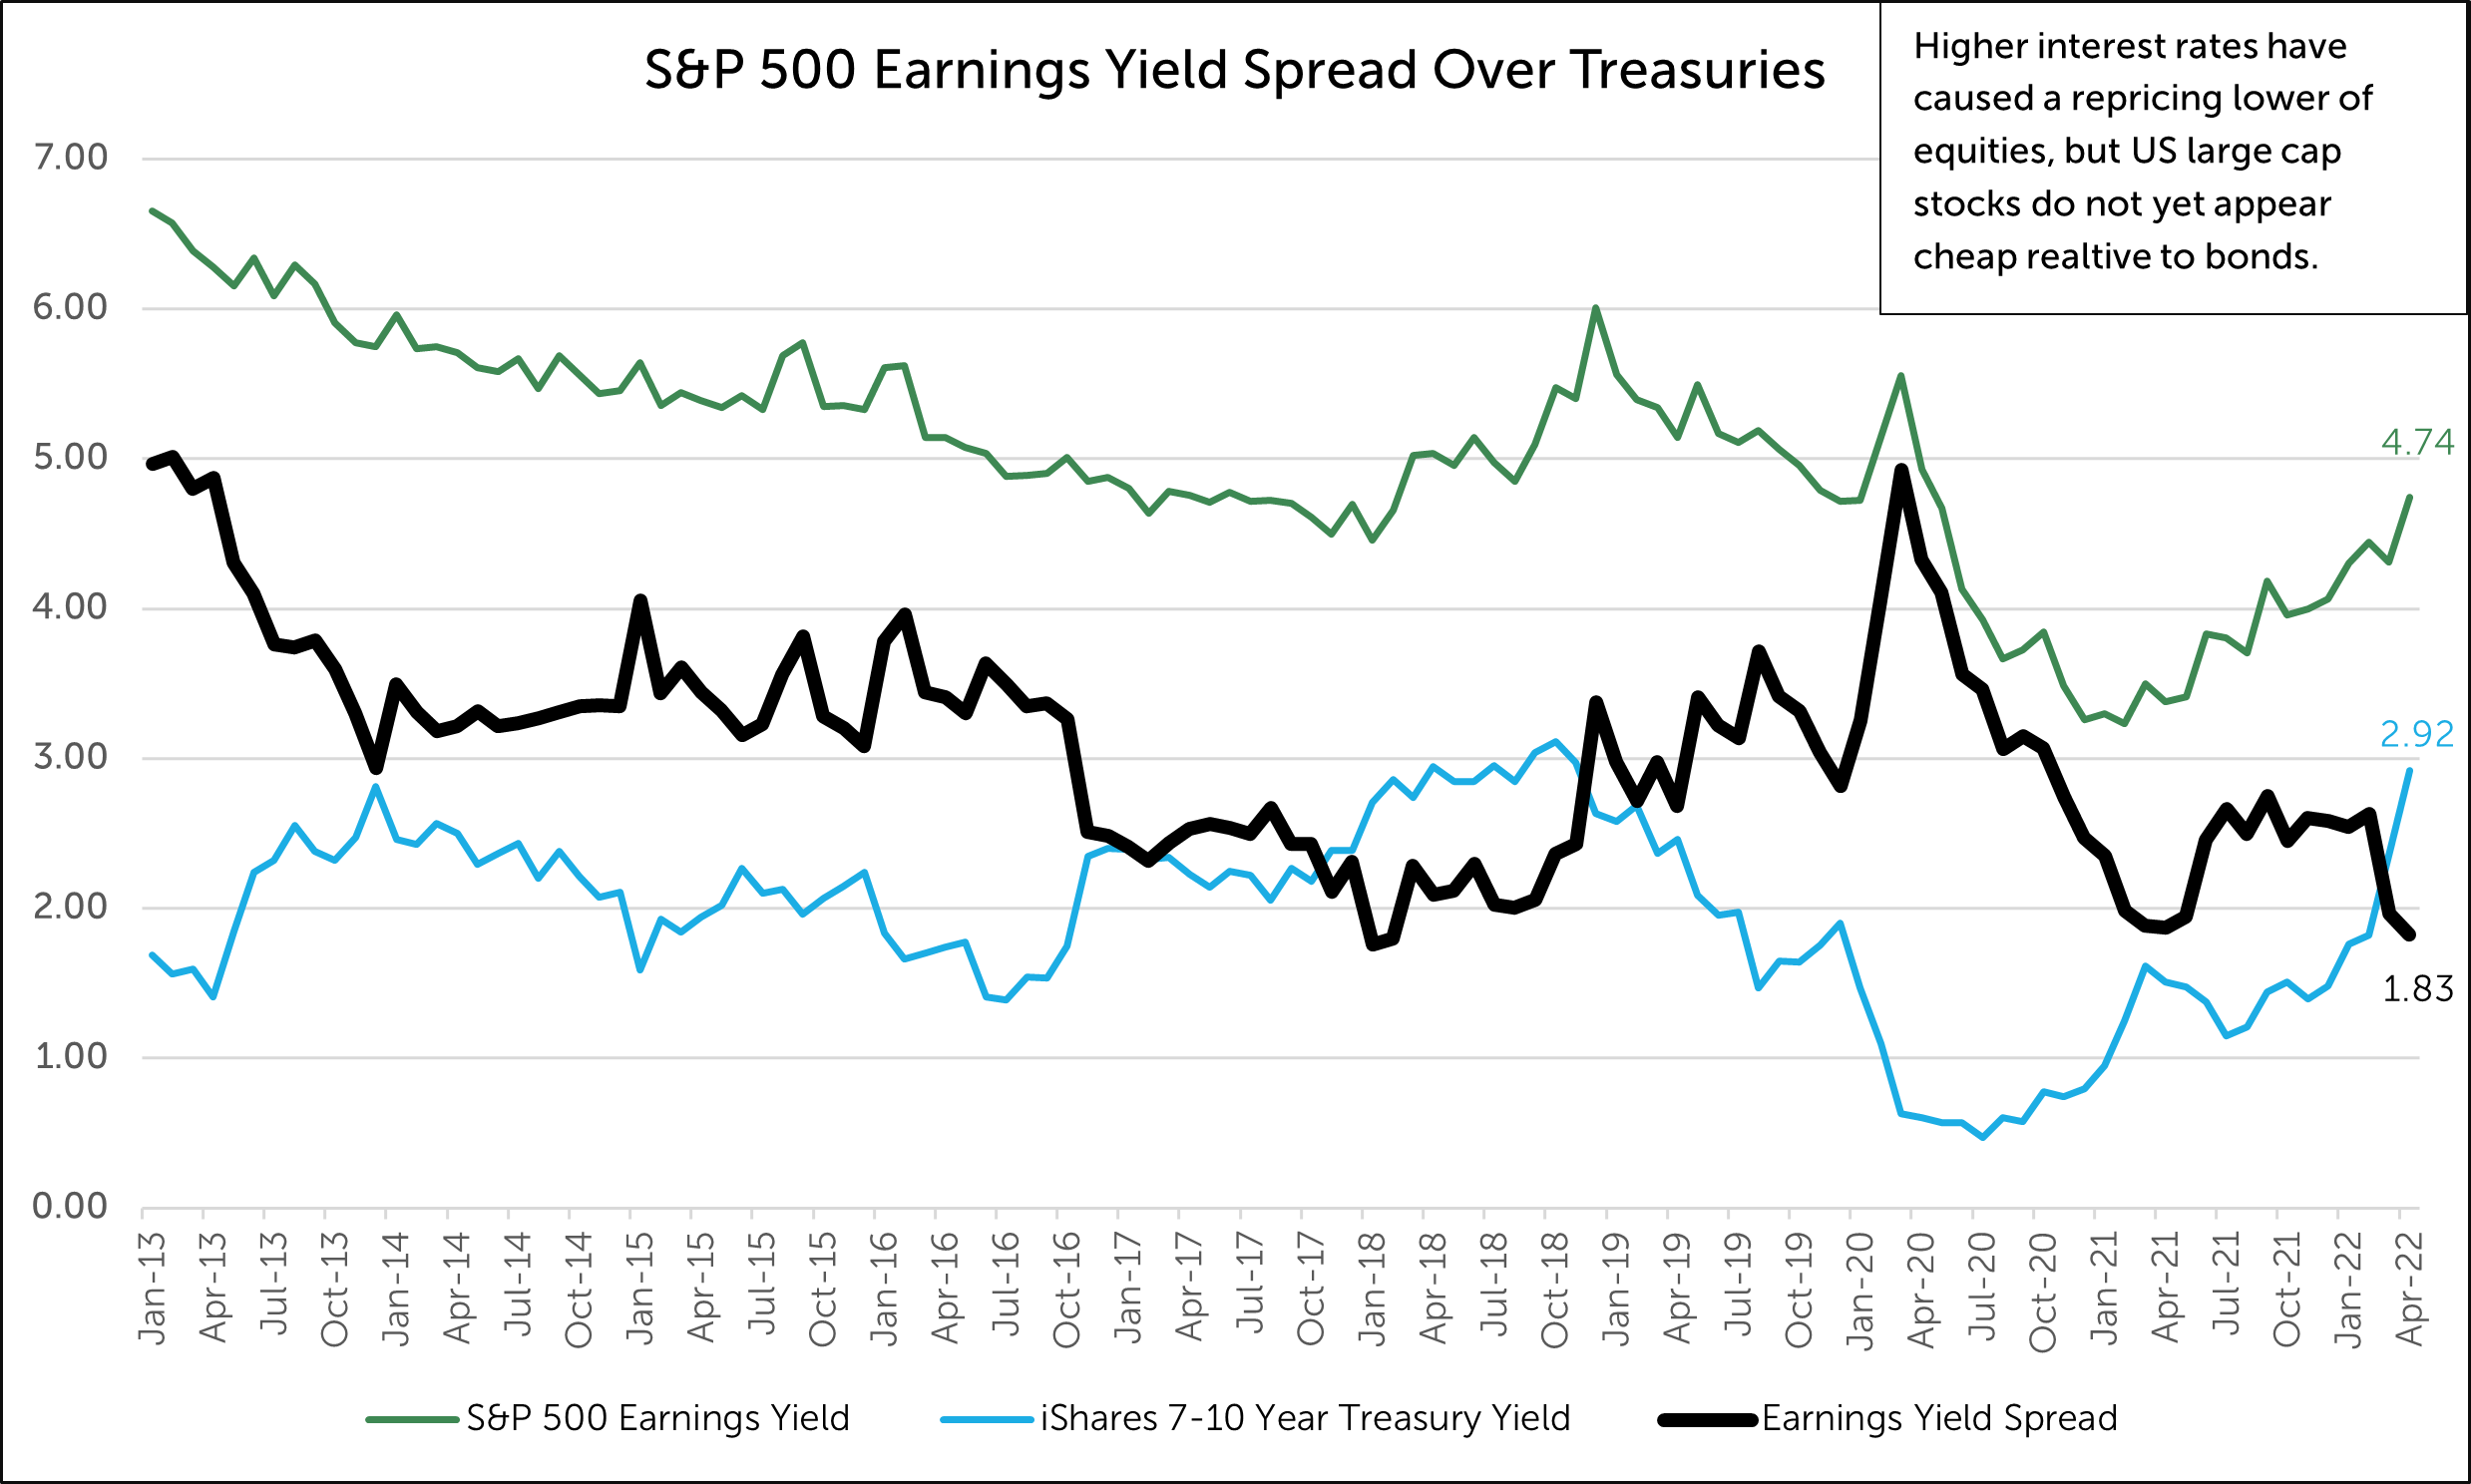
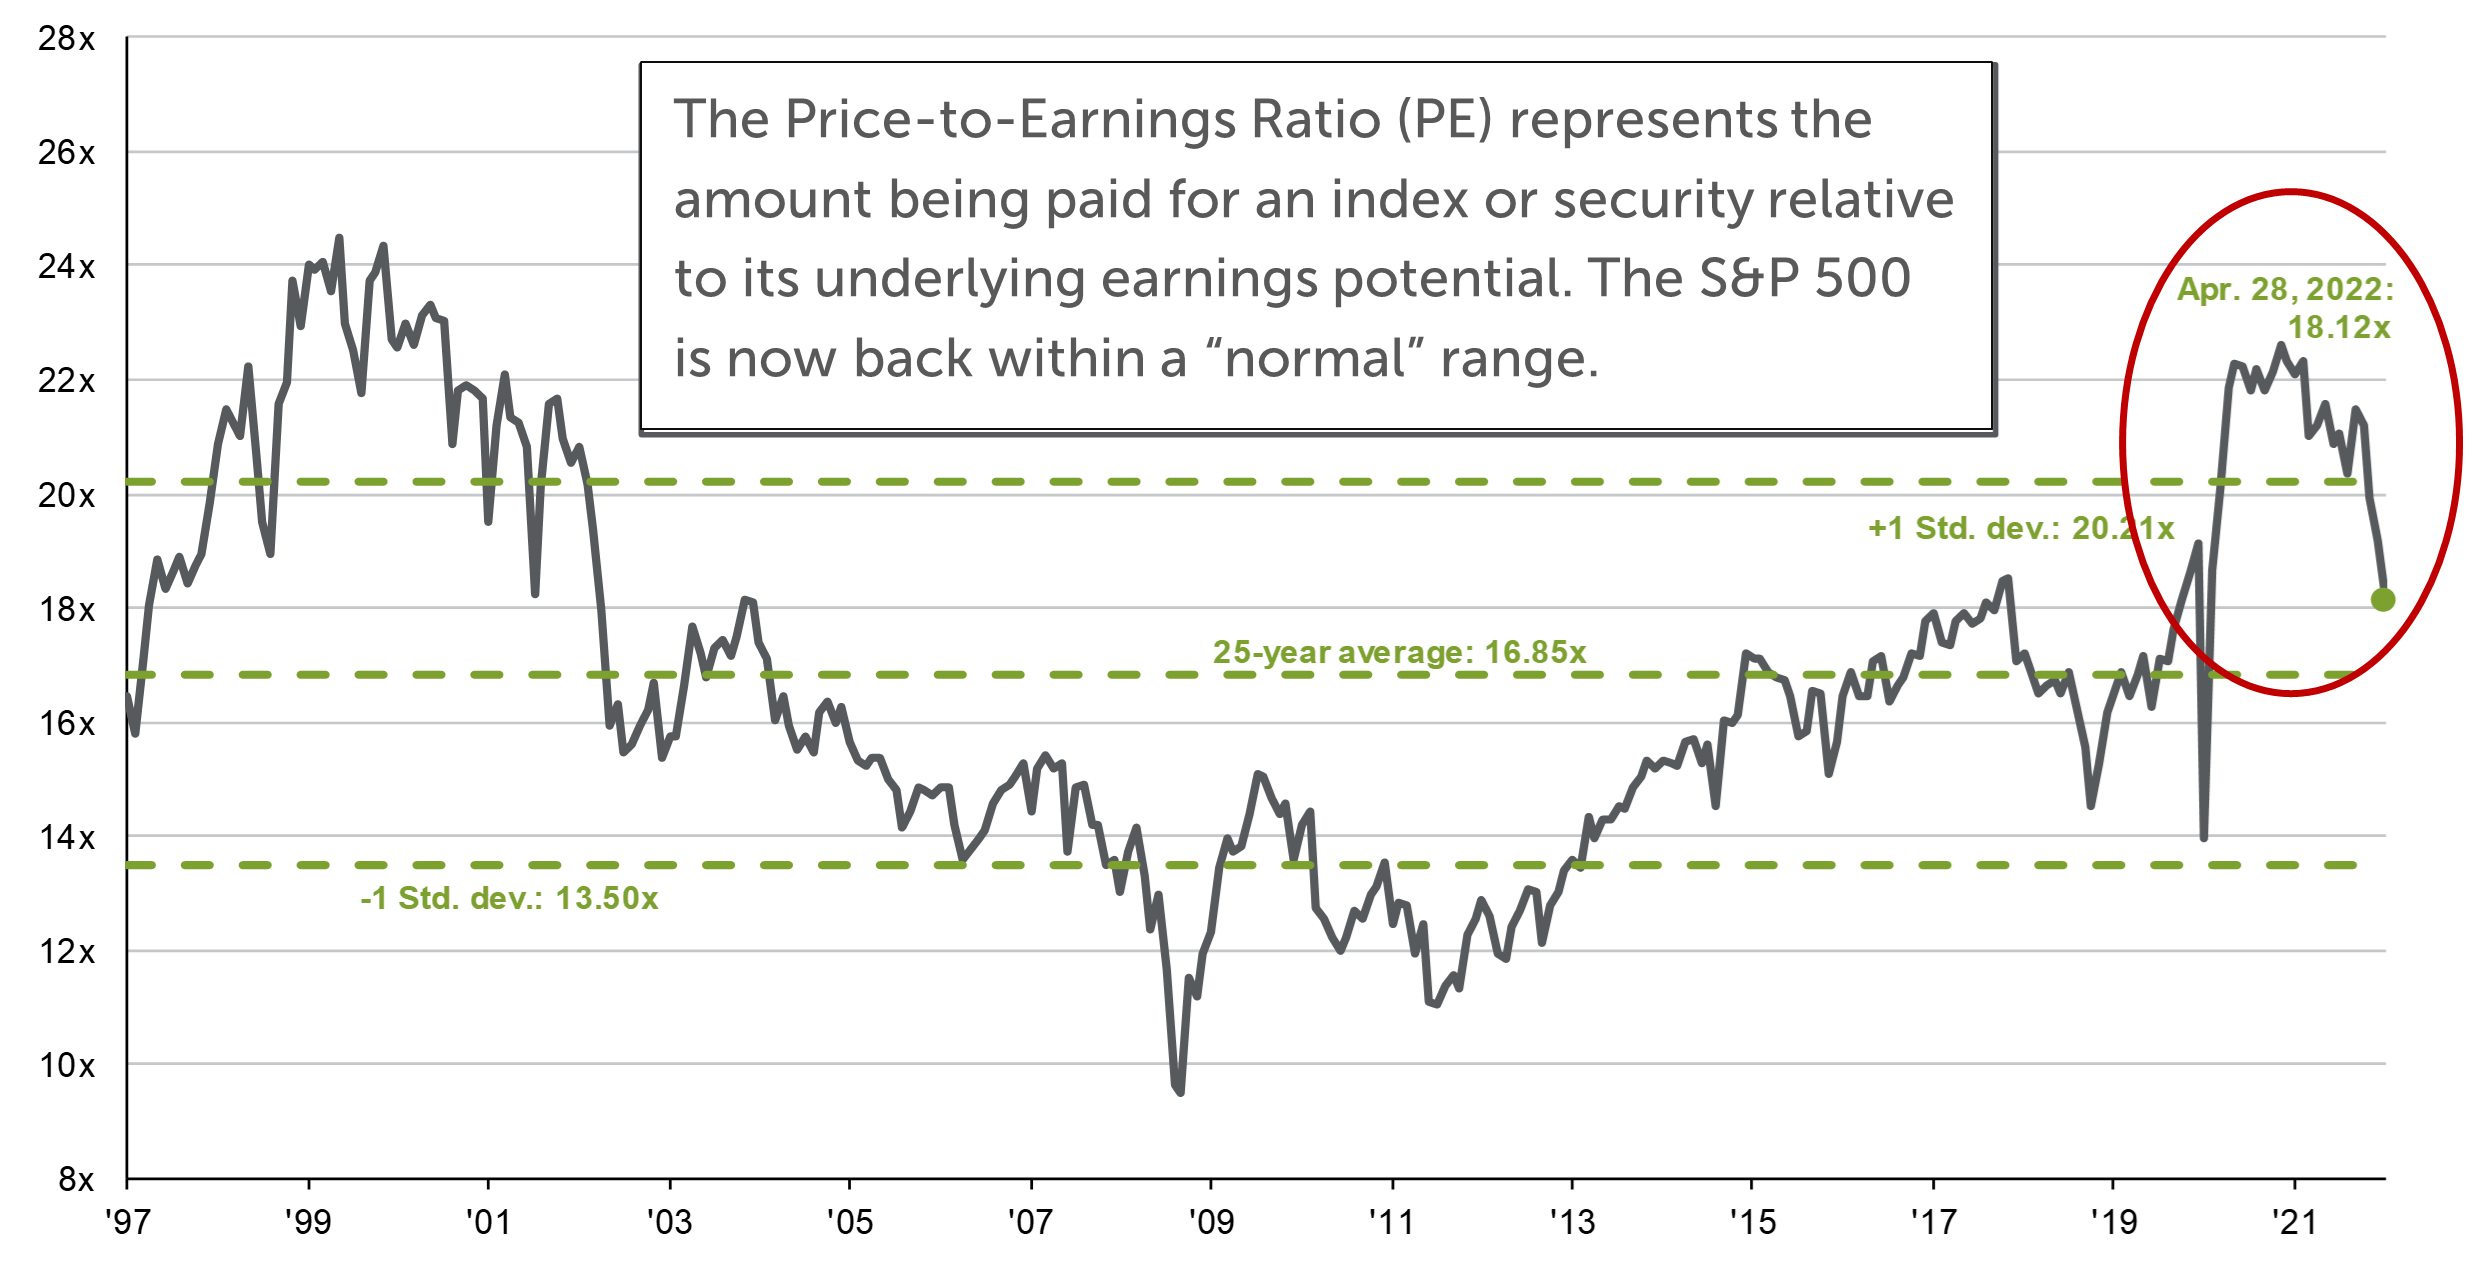
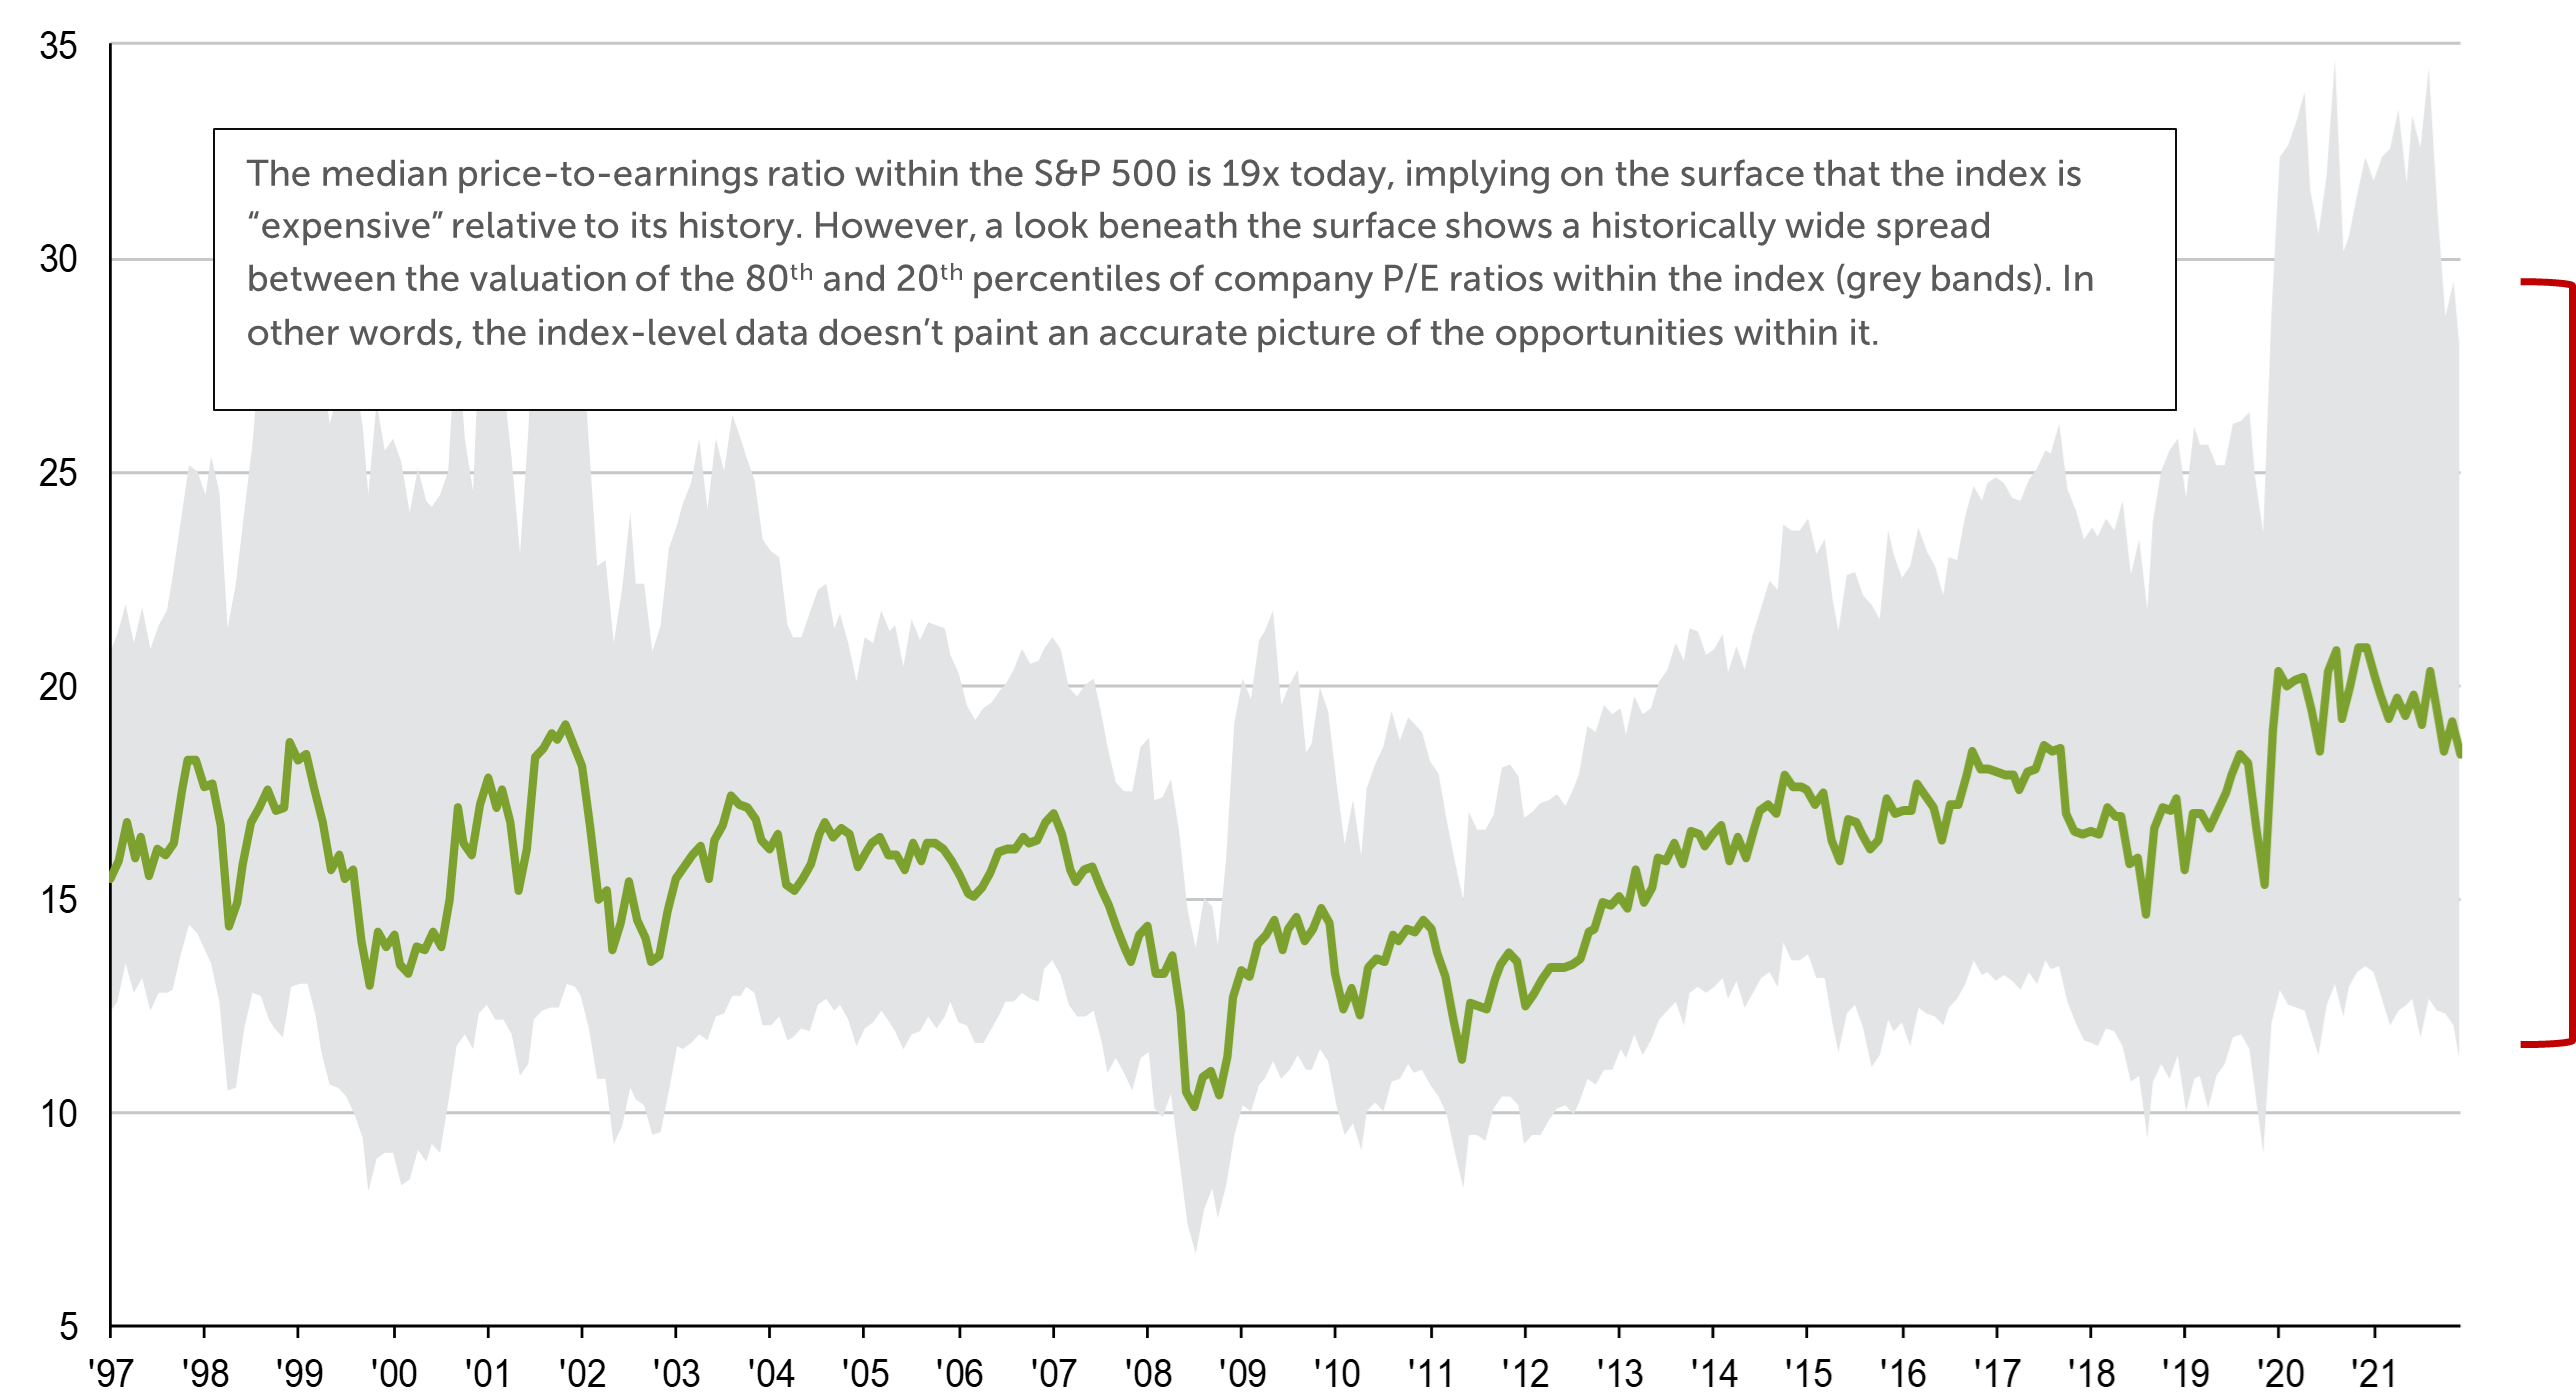
The declines in stocks in 2022 have brought most indices back into more normal valuation ranges relative to long-term averages. In addition to the risks facing equity markets (e.g., inflation, geopolitical), the pure movement higher in US Treasuries has likely been a very direct driver in the repricing lower of many stocks. The first chart below highlights the relationship between the earnings yield of the S&P 500 in green (earnings yield being the net profit earned by investors divided by the price of the index) and the yield on 7-10 year US Treasury notes (blue line). The black line represents the spread between these two, with a higher spread offering a more compelling relative value for equities compared to bonds.
S&P 500 Price-to-Expected Earnings
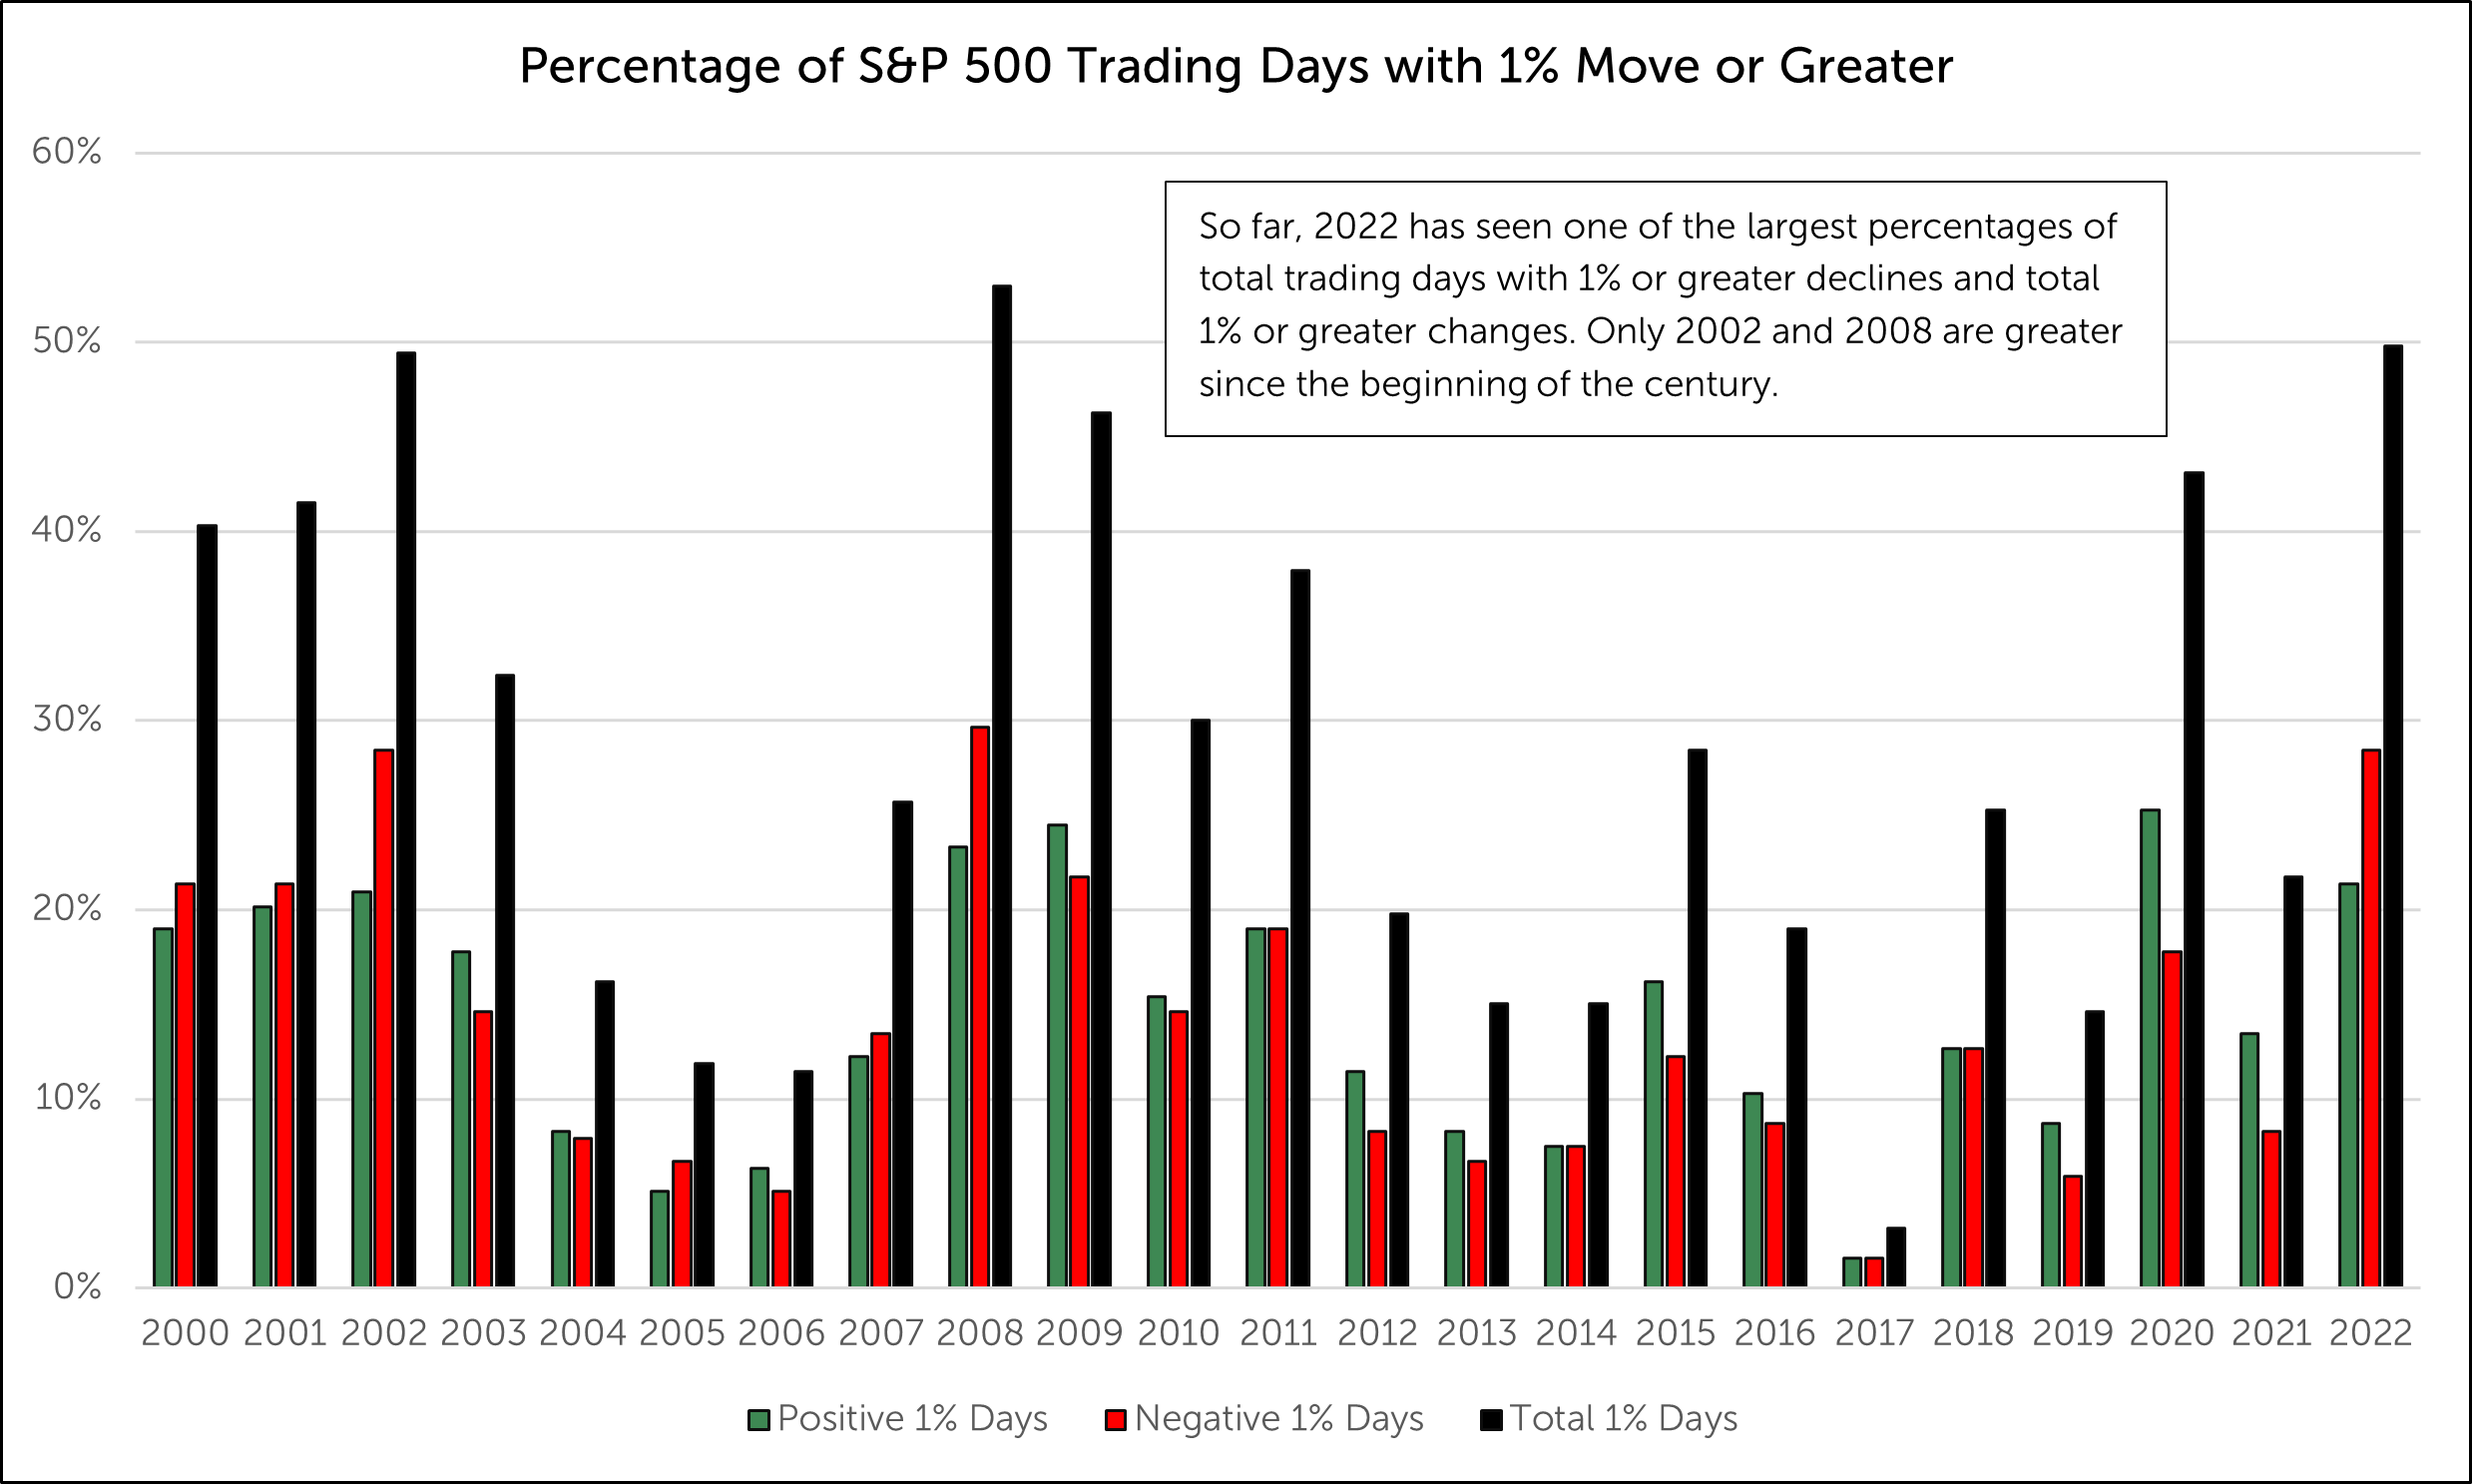
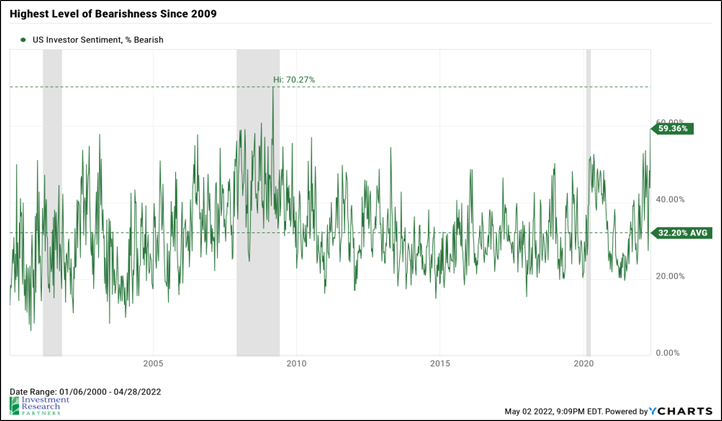
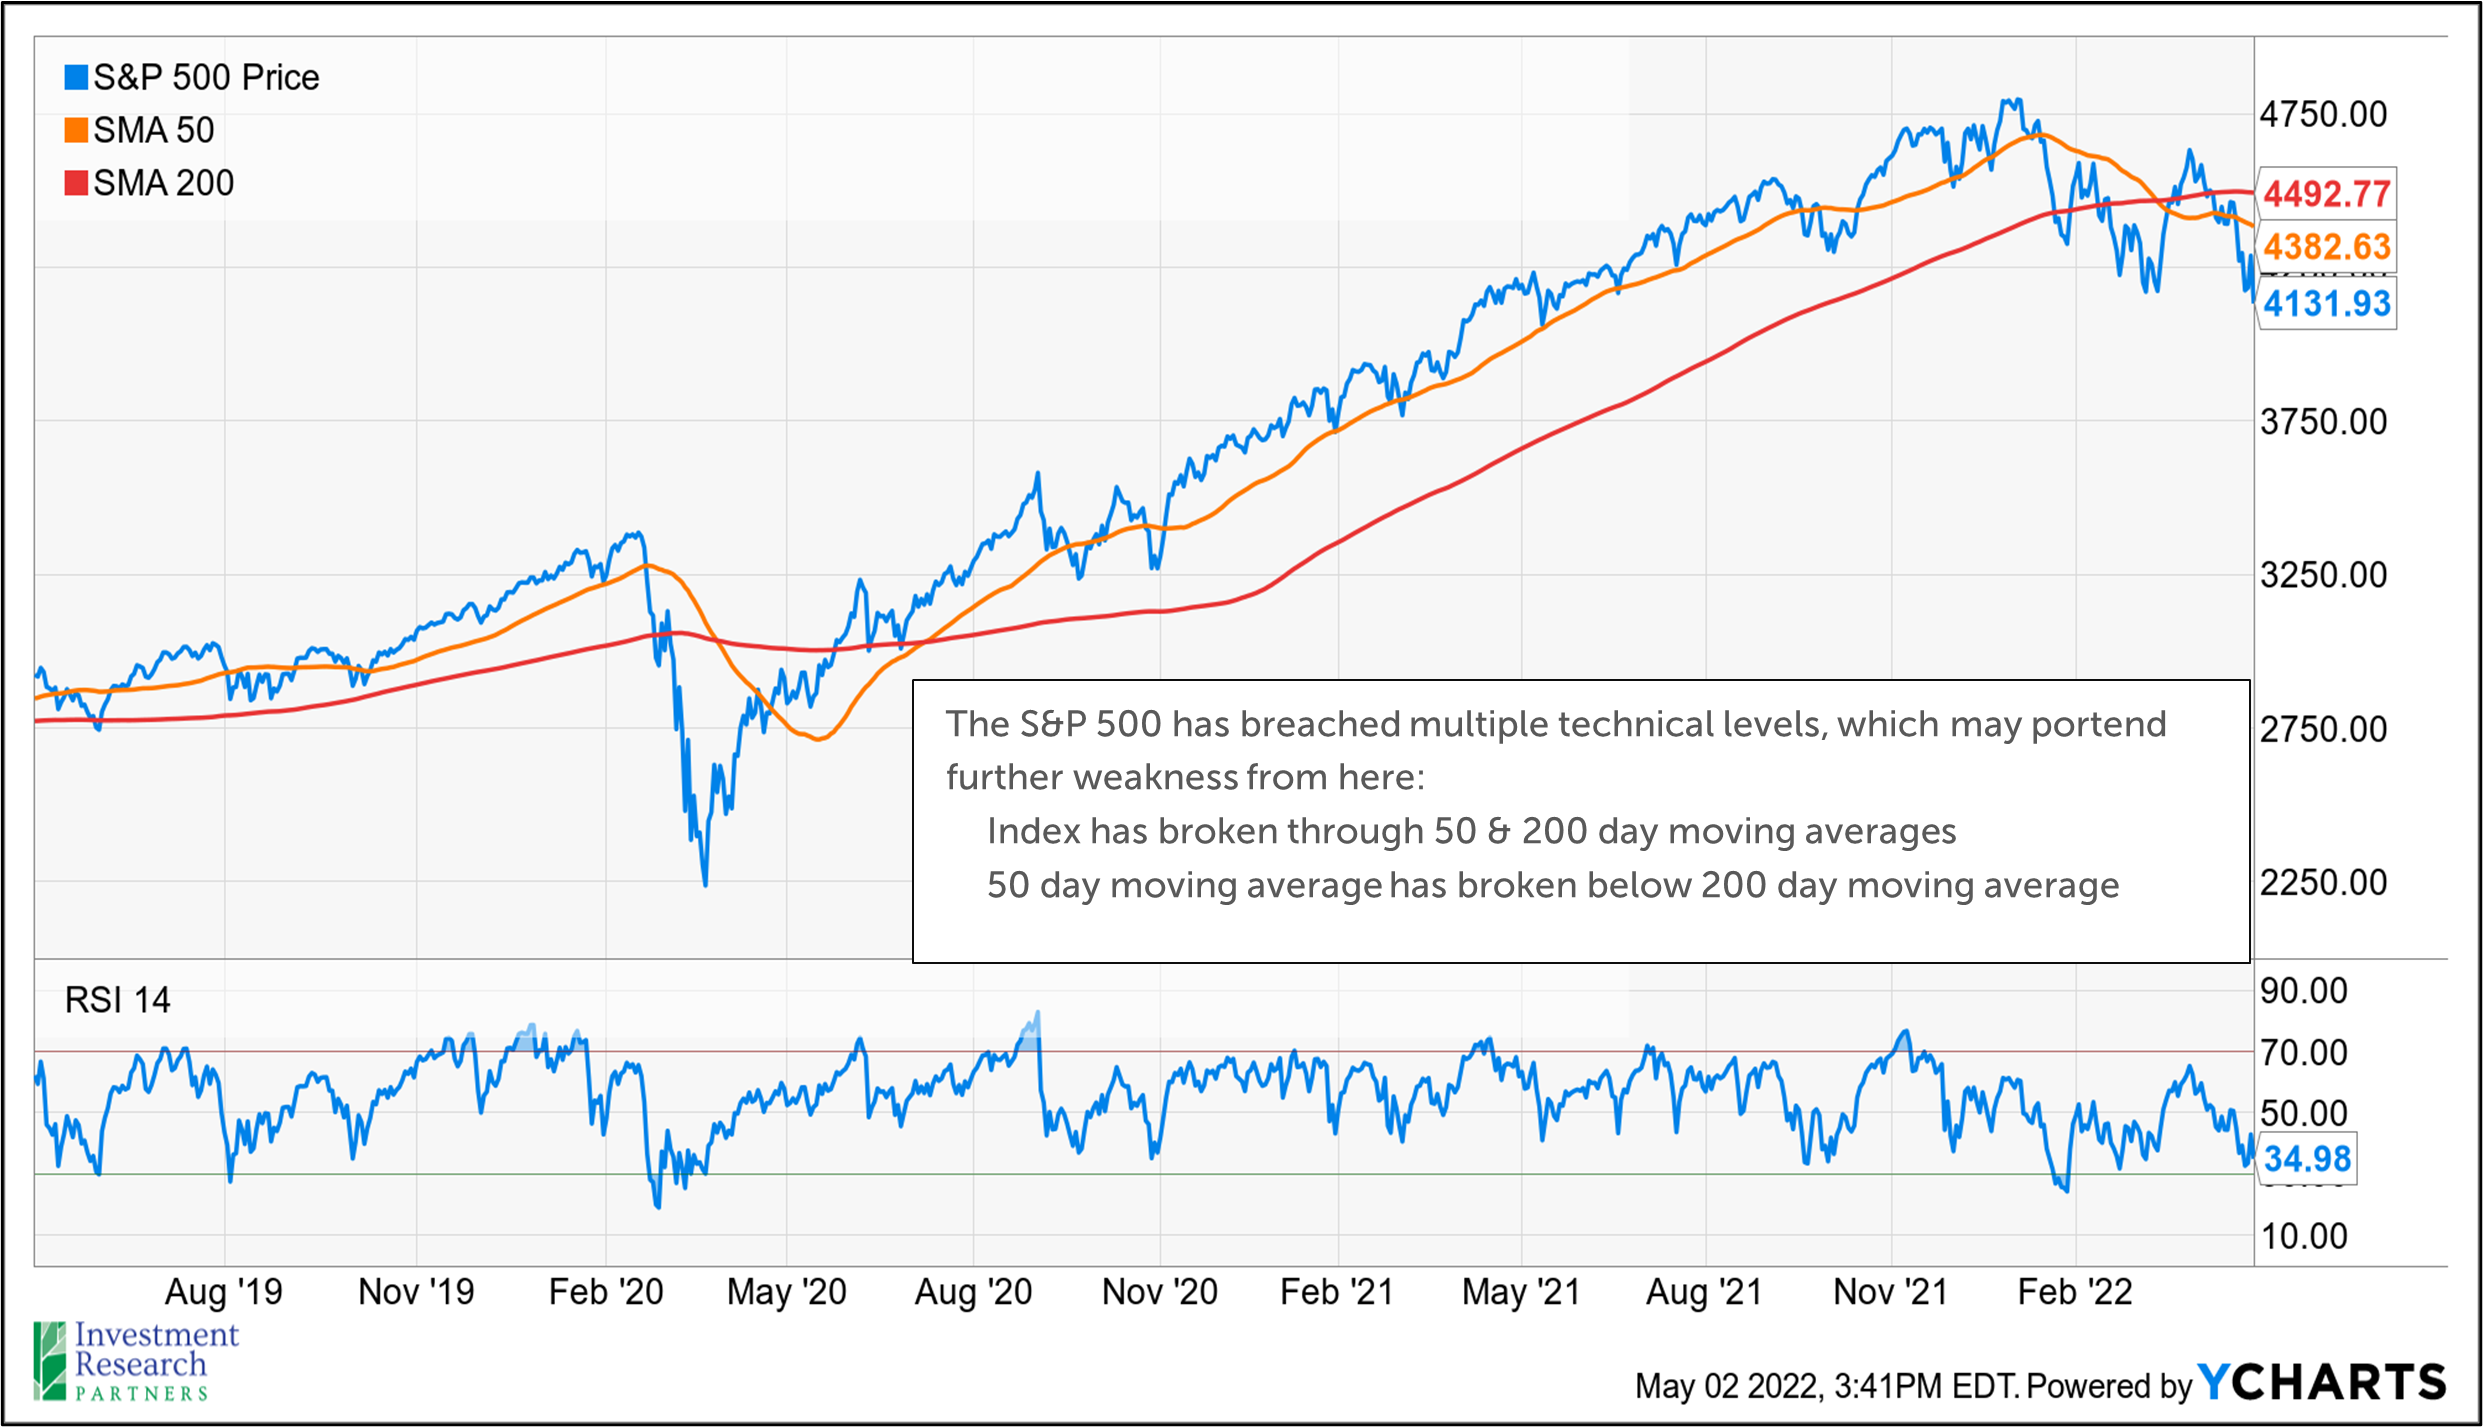
The confluence of risks facing investors today has led to the highest percentage of bears in the market since 2009. Historically, these periods of extreme pessimism have been attractive buying opportunities for long-term investors. However, we have yet to see confirming signs of a market bottoming process, and in fact, the overall trend of the S&P 500 continues to degrade. The various risks have led to 2022 being one of the most volatile years over the last two decades.
Prices & Interest Rates
| Representative Index | April 2022 | Year-End 2021 |
|---|---|---|
| Crude Oil (US WTI) | $104.69 | $75.21 |
| Gold | $1,909 | $1,828 |
| US Dollar | 102.96 | 95.97 |
| 2 Year Treasury | 2.70% | 0.73% |
| 10 Year Treasury | 2.89% | 1.52% |
| 30 Year Treasury | 2.96% | 1.90% |
| Source: Morningstar, YCharts, and US Treasury as of April 30, 2022 |
Asset Class Returns
| Category | Representative Index | April 2022 | YTD 2022 |
|---|---|---|---|
| Global Equity | MSCI All-Country World | -8.0% | -12.9% |
| Global Equity | MSCI All-Country World ESG Leaders | -7.9% | -13.7% |
| US Large Cap Equity | S&P 500 | -8.7% | -12.9% |
| US Large Cap Equity | Dow Jones Industrial Average | -5.8% | -7.4% |
| US All Cap Equity | Russell 3000 Growth | -12.1% | -20.2% |
| US All Cap Equity | Russell 3000 Value | -5.8% | -6.6% |
| US Small Cap Equity | Russell 2000 | -9.9% | -16.7% |
| Foreign Developed Equity | MSCI EAFE | -6.5% | -12.0% |
| Emerging Market Equity | MSCI Emerging Markets | -5.6% | -12.2% |
| US Fixed Income | Bloomberg Barclays Municipal Bond | -2.8% | -8.8% |
| US Fixed Income | Bloomberg Barclays US Agg Bond | -3.8% | -9.5% |
| Global Fixed Income | Bloomberg Barclays Global Agg. Bond | -5.5% | -11.3% |
| Source: YCharts as of April 30, 2022 | |||
Download PDF Version
Past performance may not be representative of future results. All investments are subject to loss. Forecasts regarding the market or economy are subject to a wide range of possible outcomes. The views presented in this market update may prove to be inaccurate for a variety of factors. These views are as of the date listed above and are subject to change based on changes in fundamental economic or market-related data. Please contact your Financial Advisor in order to complete an updated risk assessment to ensure that your investment allocation is appropriate.