


May 4, 2021 •OneAscent

US stock market indices, such as the S&P 500, touched new all-time highs in April as economic, household, and business data all continued to imply that the recovery from the COVID-19 economic recession remains on track and stable. As of this writing, nearly 45% of US adults have received at least one vaccine dose, and the rollout of the vaccine campaign in the US has led to a stark divergence in the performance of various equity sectors and industries since late 2020 (see graph below).
Percentage of Adults that Have Received At Least One Vaccine Dose
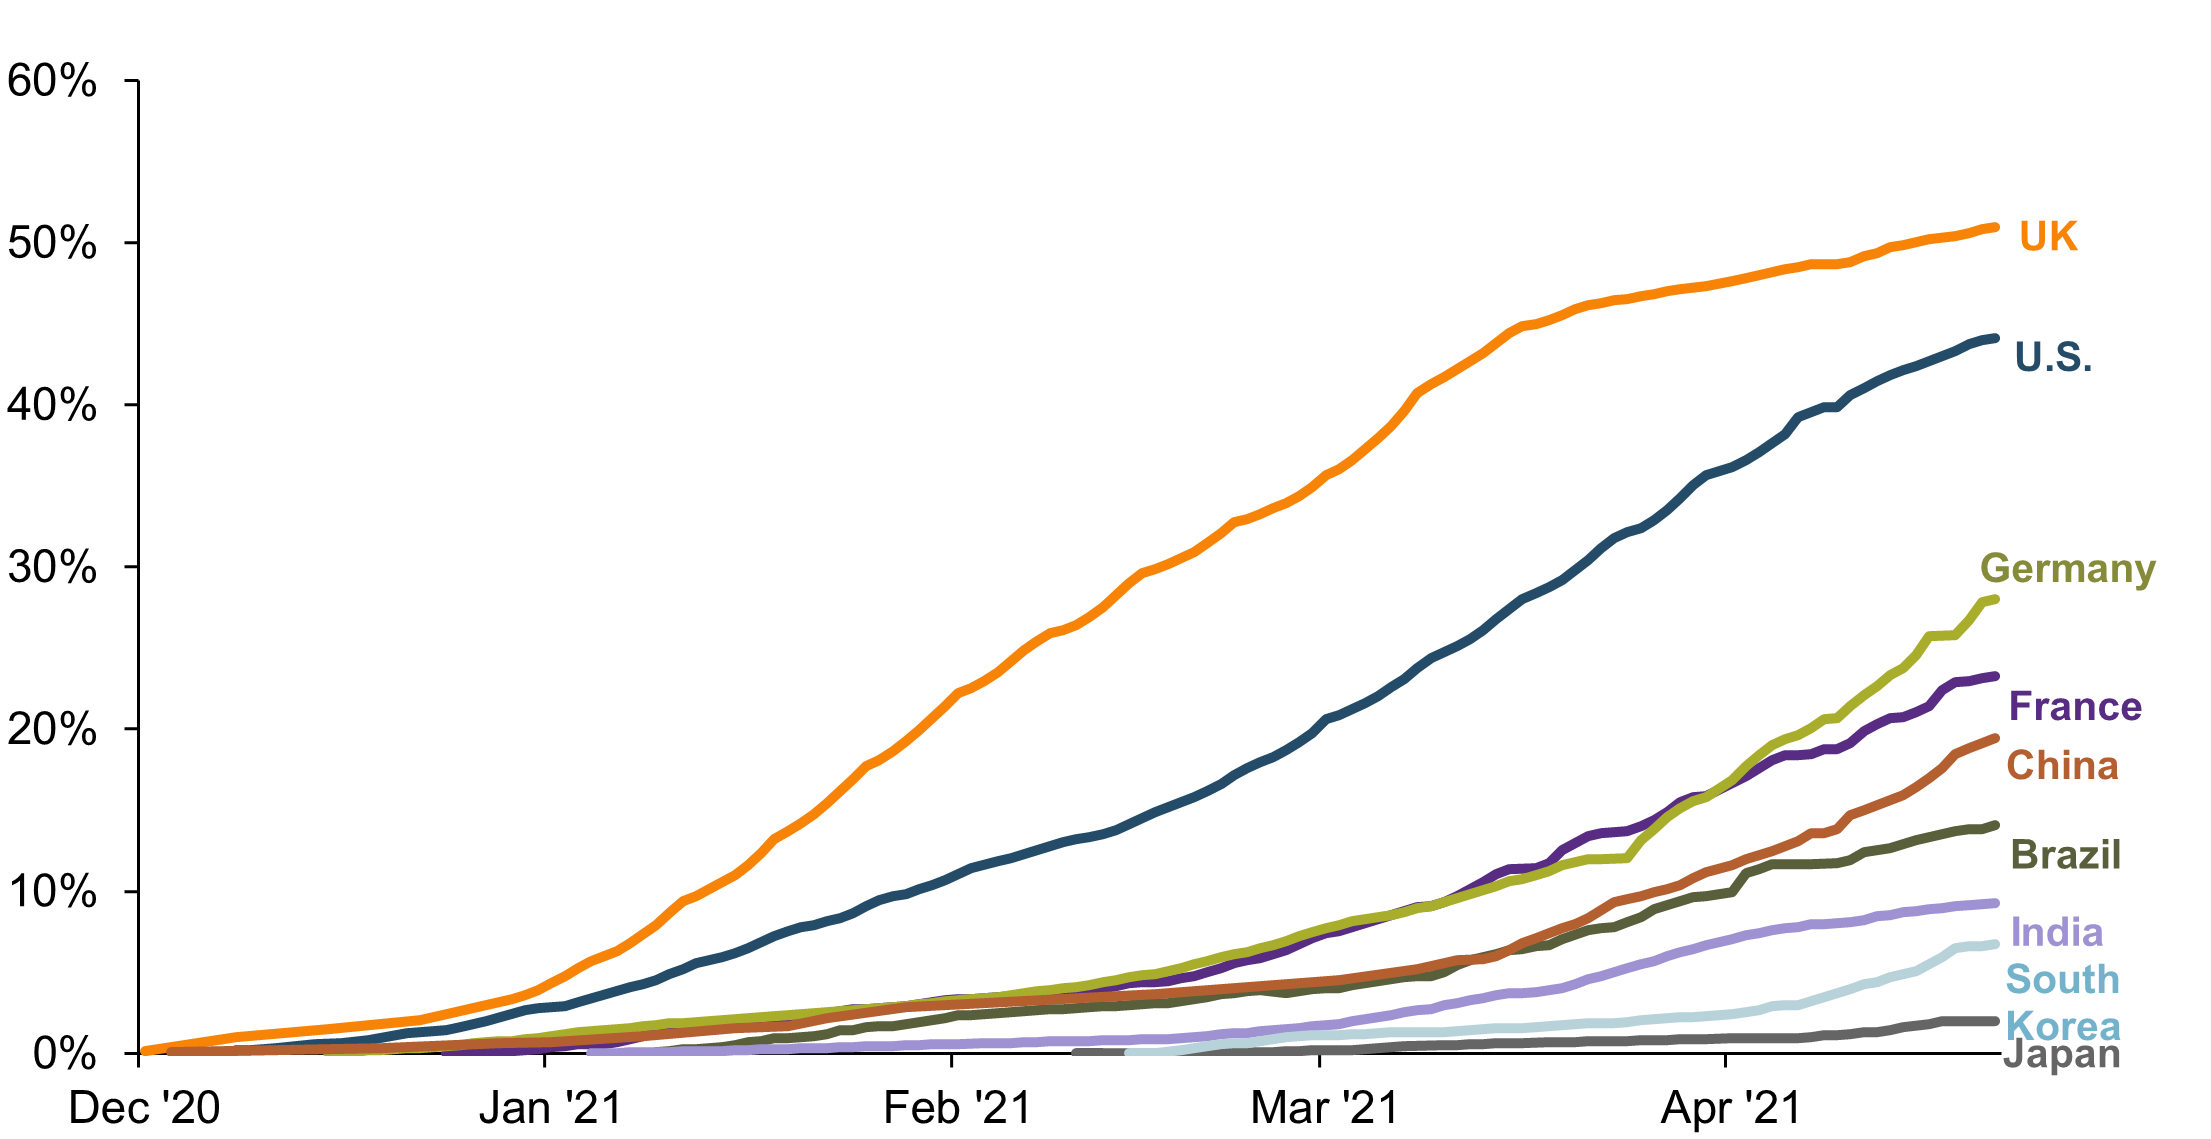
JPMorgan as of May 4, 2021
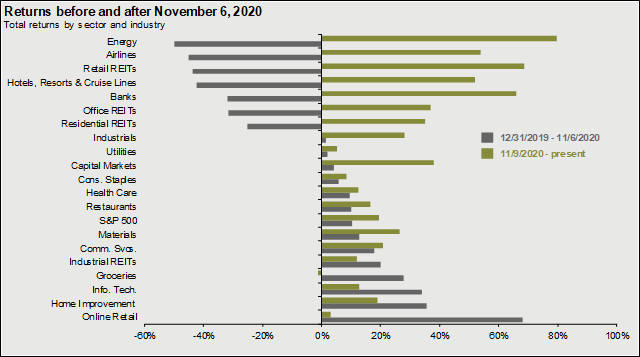
Industries such as energy, airlines, hotels have advanced by nearly 50% over the past six months after having declined roughly 50% in the preceding nine months during the quarantine period. Comparatively, industries that thrived during the lockdown such as online retail have performed below the broad market since the vaccine rollout (see chart below).
The discussion of additional fiscal stimulus in the form of infrastructure spending that could include expanded childcare support and clean energy, in addition to traditional roads and bridges, has also driven the prices of industrial and materials stocks higher. On balance, the economic backdrop appears favorable for investing, though the prices of traditional stocks and bond indices are above historical averages, and the abrupt nature of the recession recovery may lead to inflationary pressures that could slow economic growth and corporate profitability.
JPMorgan as of May 4, 2021
The labor market has continued its recovery, though the total number of employed Americans is still well-below pre-pandemic levels (see chart below). In early May, the US Bureau of Labor Statistics released their monthly assessment of labor market conditions. In a surprise disappointing report, the unemployment rate increased to 6.1% from 6.0% as only 266,000 new jobs were added to the economy while the consensus estimate from economists was expecting 1,000,000.
The economy remains more than 8 million jobs short of pre-pandemic levels, which allows significant room for labor market gains before capacity runs out, which has typically been a challenging point in economic cycles as wage inflation may begin to pressure company profitability on average. In April, leisure and hospitality jobs rose by 331,000 following similar gains during the previous two months as a sign that consumers are anxious to resume in-person activities like dining and travel.
Total Non-Farm US Payrolls (millions)
-May-2021-Monthly-Investment-Update-OneAscent-Financial.png)
Source: Bloomberg
Above average inflation, which has not been a significant concern for most investors in more than a decade is now discussed regularly in the financial media and on corporate earnings calls. Companies are facing challenges sourcing materials and labor, and in the case of the auto industry, some manufacturers like Ford have shut down portions of their production as critical components like semi-conductors are unavailable.
Low interest rates, fiscal stimulus, and (potentially) the trend away from urbanization in a work-from-home environment has increased demand for homes and home improvements. The supply gaps caused by the pandemic juxtaposed against above-average demand have led to significant spikes in the price of lumber, which has increased more than 85% in 2021.
Implied Expected Future Inflation (5 Year Treasury Inflation Protected Securities Break-Even Rate)
-May-2021-Monthly-Investment-Update-OneAscent-Financial.png)
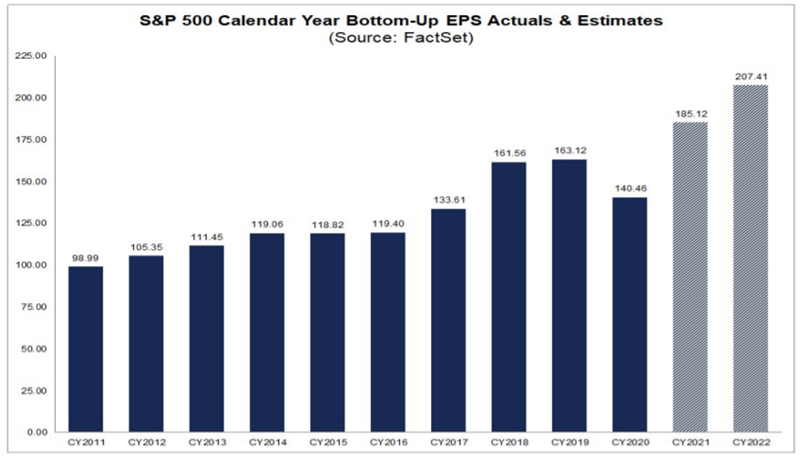
Expectations for Q1 earnings have been increasing with analysts now estimating year-over-year earnings growth for the S&P 500 index during the quarter to be more than 40% higher than last year. Analysts are also increasing their forecasts for full-year 2021 and 2022 earnings, which has likely helped to drive up the price of the S&P 500 over the last several weeks. The chart below highlights analysts’ consensus expectations for calendar year earnings as of late April. For calendar year 2021 and 2022, the consensus analyst estimate is for the S&P 500 to earn $185 and $207, respectively. Those estimates are up from $175 and $202 estimates as of late March.
Given that the index is trading at approximately 4,200 as of this writing, this would imply that investors are willing to pay 23x for 2021 earnings and 20x for 2022 earnings. While these multiples are above long-term averages, the low interest rate environment and robust expectation for earnings growth may be supporting investors’ enthusiasm. It is important to note that these are only estimates for index earnings in 2021 and 2022, so investors may experience significant price compression in the index if these earnings gains fail to materialize. Our primary concern related to earnings growth would be the inability for companies to source needed materials, potentially resulting in lower inventories and revenues, as well as the risk of higher input and labor costs that may simultaneously pressure profitability.
We monitor the backdrop for investing in risk assets across three primary pillars: economic conditions, asset prices, and technical considerations such as investor sentiment. On balance, we still believe that conditions are favorable for accepting investment risk, but there is a stark divergence between these underlying pillars.
For example, economic conditions are very favorable with the labor market improving (and continued room for hiring) and corporate earnings are trending higher. In addition, household balance sheets are healthy, partially thanks to the unprecedented level of support from the federal government and Federal Reserve in the form of direct payments to households, enhanced unemployment benefits, and very low borrowing costs. The above-average rise in prices, particularly related to energy and housing, and accounts of significant supply gaps for manufacturing and construction materials are the one primary concern for the economy today.
Technical considerations like investor sentiment and asset price trends remain favorable, as well. There were signs of investor exuberance earlier this year, but those have dissipated somewhat as high-flying assets such as technology stocks, clean energy companies, and cryptocurrencies have taken a pause.
This favorable economic and technical backdrop is no secret and is being fully reflected in the price of many assets today. For example, the S&P 500 index has touched multiple all-time highs this year and has already returned 12% through April after returning 18% in 2020. The backdrop is favorable, but asset prices leave little room for error and potentially put investors in a precarious position if economic conditions were to unexpectedly change like they did in early 2020.
Given current conditions, we advocate that investors:
Thank you for your time and continued support. We look forward to a summer season that feels a bit more “normal” than the last.
Asset Class Returns
| Category | Representative Index | March 2021 | YTD 2021 | Full Year 2020 |
|---|---|---|---|---|
| Global Equity | MSCI All-Country World | 2.7% | 4.6% | 16.3% |
| US Large Cap Equity | S&P 500 | 4.4% | 6.2% | 18.4% |
| US Small Cap Equity | Russell 2000 | 1.0% | 12.7% | 20.0% |
| Foreign Developed Equity | MSCI EAFE | 2.3% | 3.5% | 7.8% |
| Emerging Market Equity | MSCI Emerging Markets | -1.5% | 2.3% | 18.3% |
| US High Yield Fixed Income | ICE BofAML High Yield Bond | 0.2% | 0.9% | 6.2% |
| US Fixed Income | Bloomberg Barclays US Aggregate Bond | -1.3% | -3.4% | 7.5% |
| Cash Equivalents | ICE BofAML 0-3 Mo Deposit | 0.0% | 0.0% | 0.5% |
| Source: Morningstar (total returns shown gross of fees) As of March 31, 2021 |
Prices & Interest Rates
| Representative Index | April 30, 2021 | Year-End 2020 |
|---|---|---|
| S&P 500 | 4,175 | 3,756 |
| Dow Jones Industrial Avg. | 33,767 | 30,606 |
| NASDAQ | 13,850 | 12,888 |
| Crude Oil (US WTI) | $63.58 | $48.42 |
| Gold | $1,767 | $1,902 |
| US Dollar | 91.28 | 89.94 |
| 2 Year Treasury | 0.16% | 0.13% |
| 10 Year Treasury | 1.58% | 0.93% |
| 30 Year Treasury | 2.24% | 1.65% |
| Source: Bloomberg, US Treasury (total returns shown gross of fees) As of April 30, 2021 |
Past performance may not be representative of future results. All investments are subject to loss. Forecasts regarding the market or economy are subject to a wide range of possible outcomes. The views presented in this market update may prove to be inaccurate for a variety of factors. These views are as of the date listed above and are subject to change based on changes in fundamental economic or market-related data. Please contact your Financial Advisor in order to complete an updated risk assessment to ensure that your investment allocation is appropriate.