


March 9, 2022 •OneAscent

Any attempts for an investment management firm to accurately describe the horror and tragedy that is occurring in Ukraine would undoubtedly fall short. The potential silver lining to these awful events is that they are occurring in the age of social media, in which the raw truth of the human suffering has spread across the globe uniting nations and peoples in a singular resolute voice not seen in our lifetimes. Because it is our role to navigate and communicate the economic implications of these events, the balance of this letter will focus there.
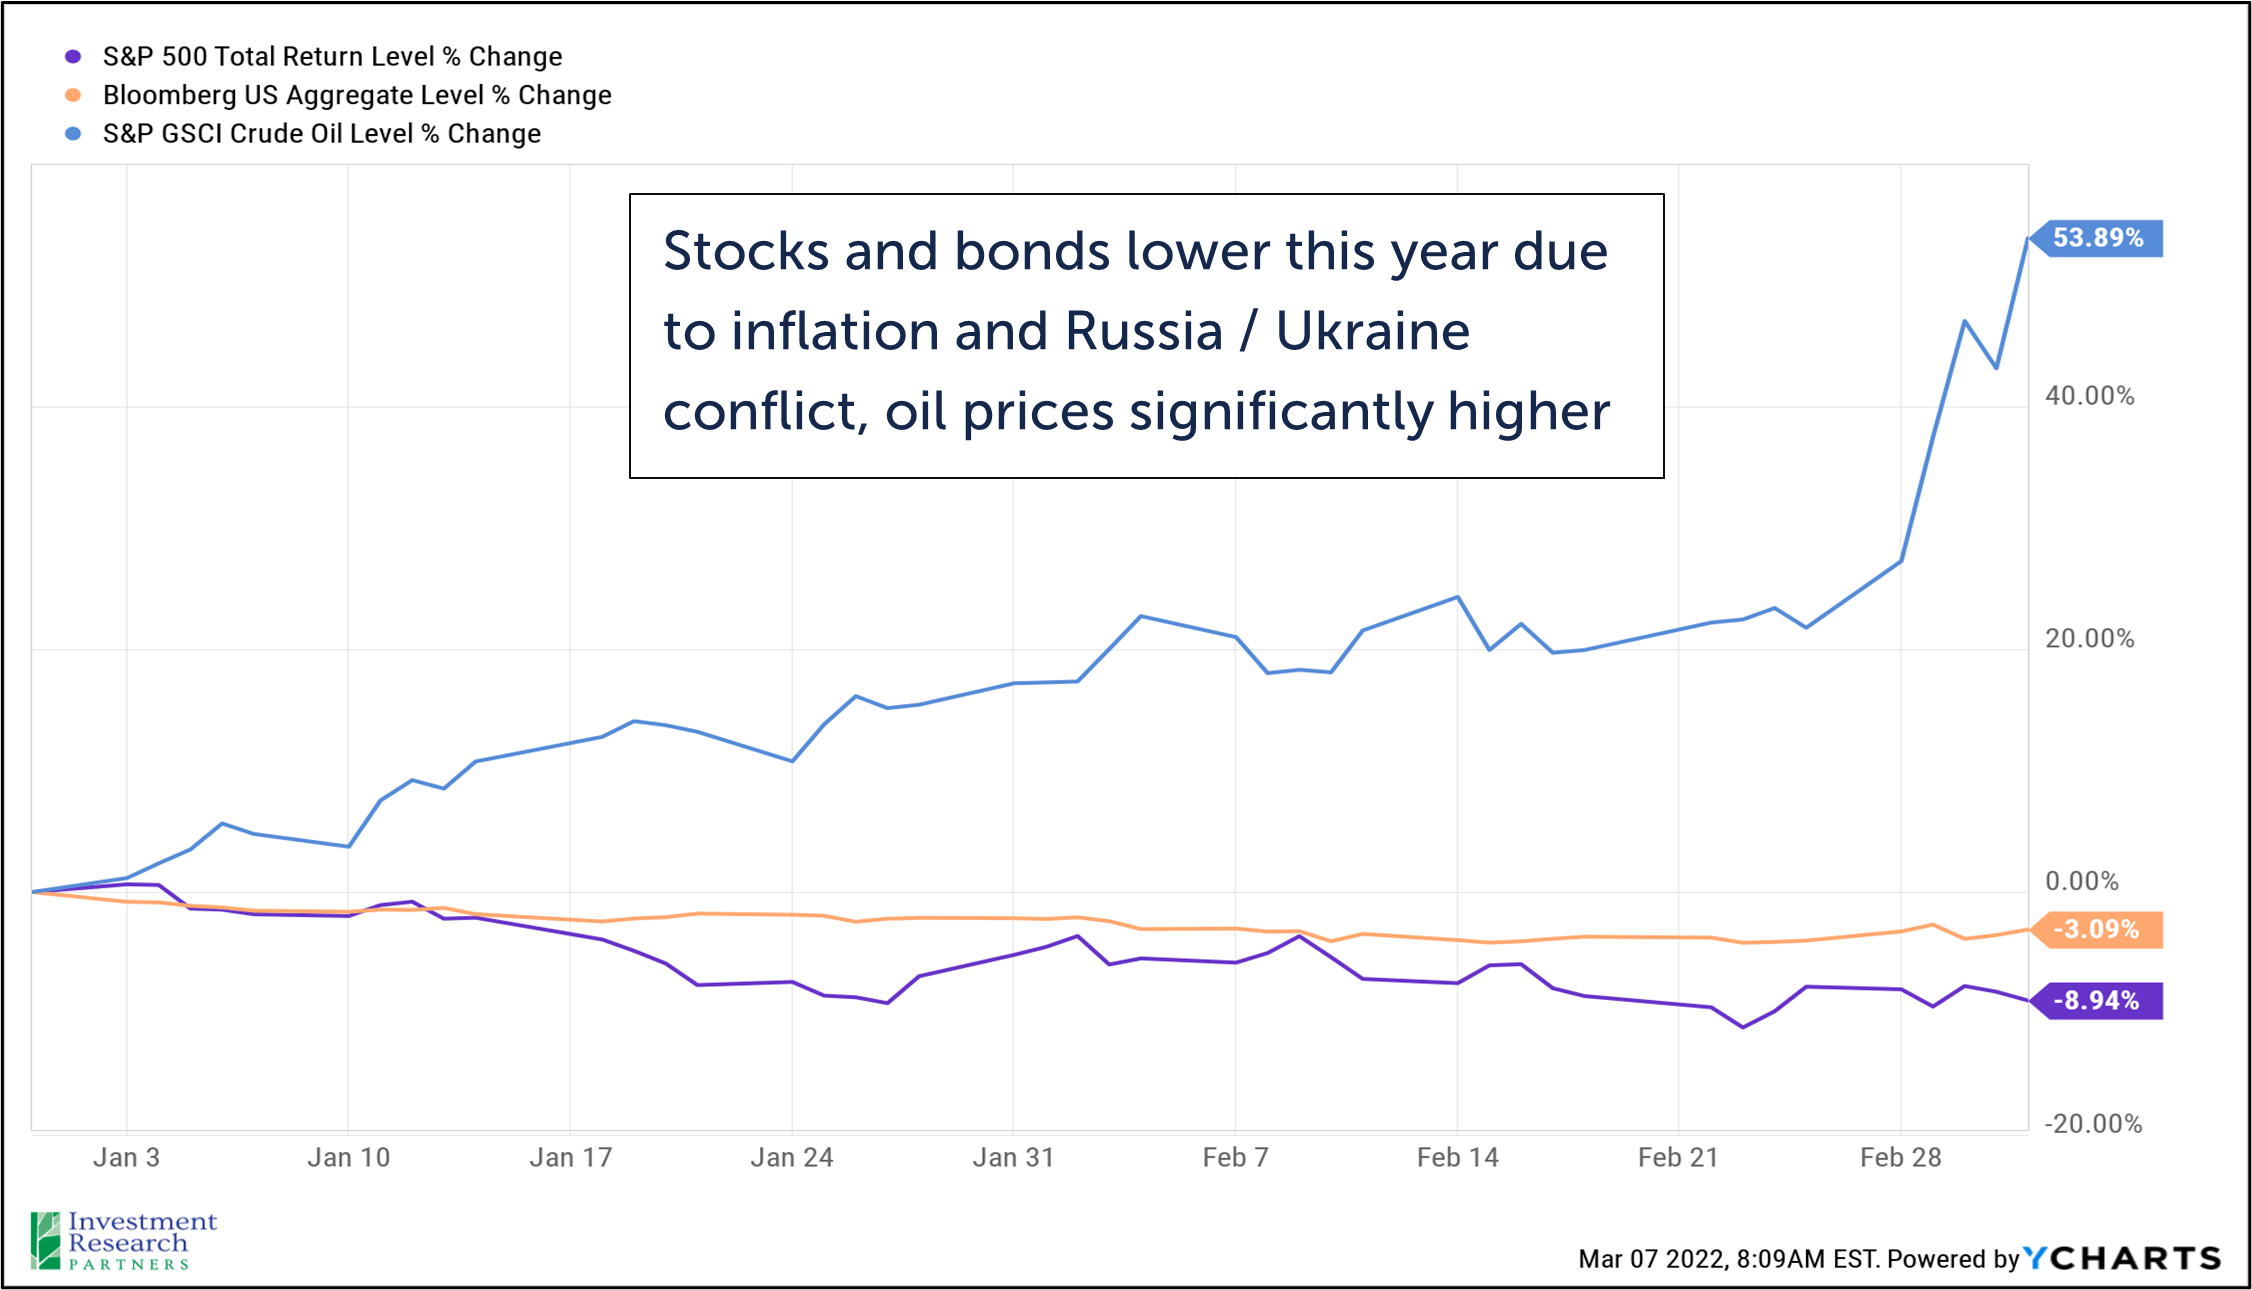
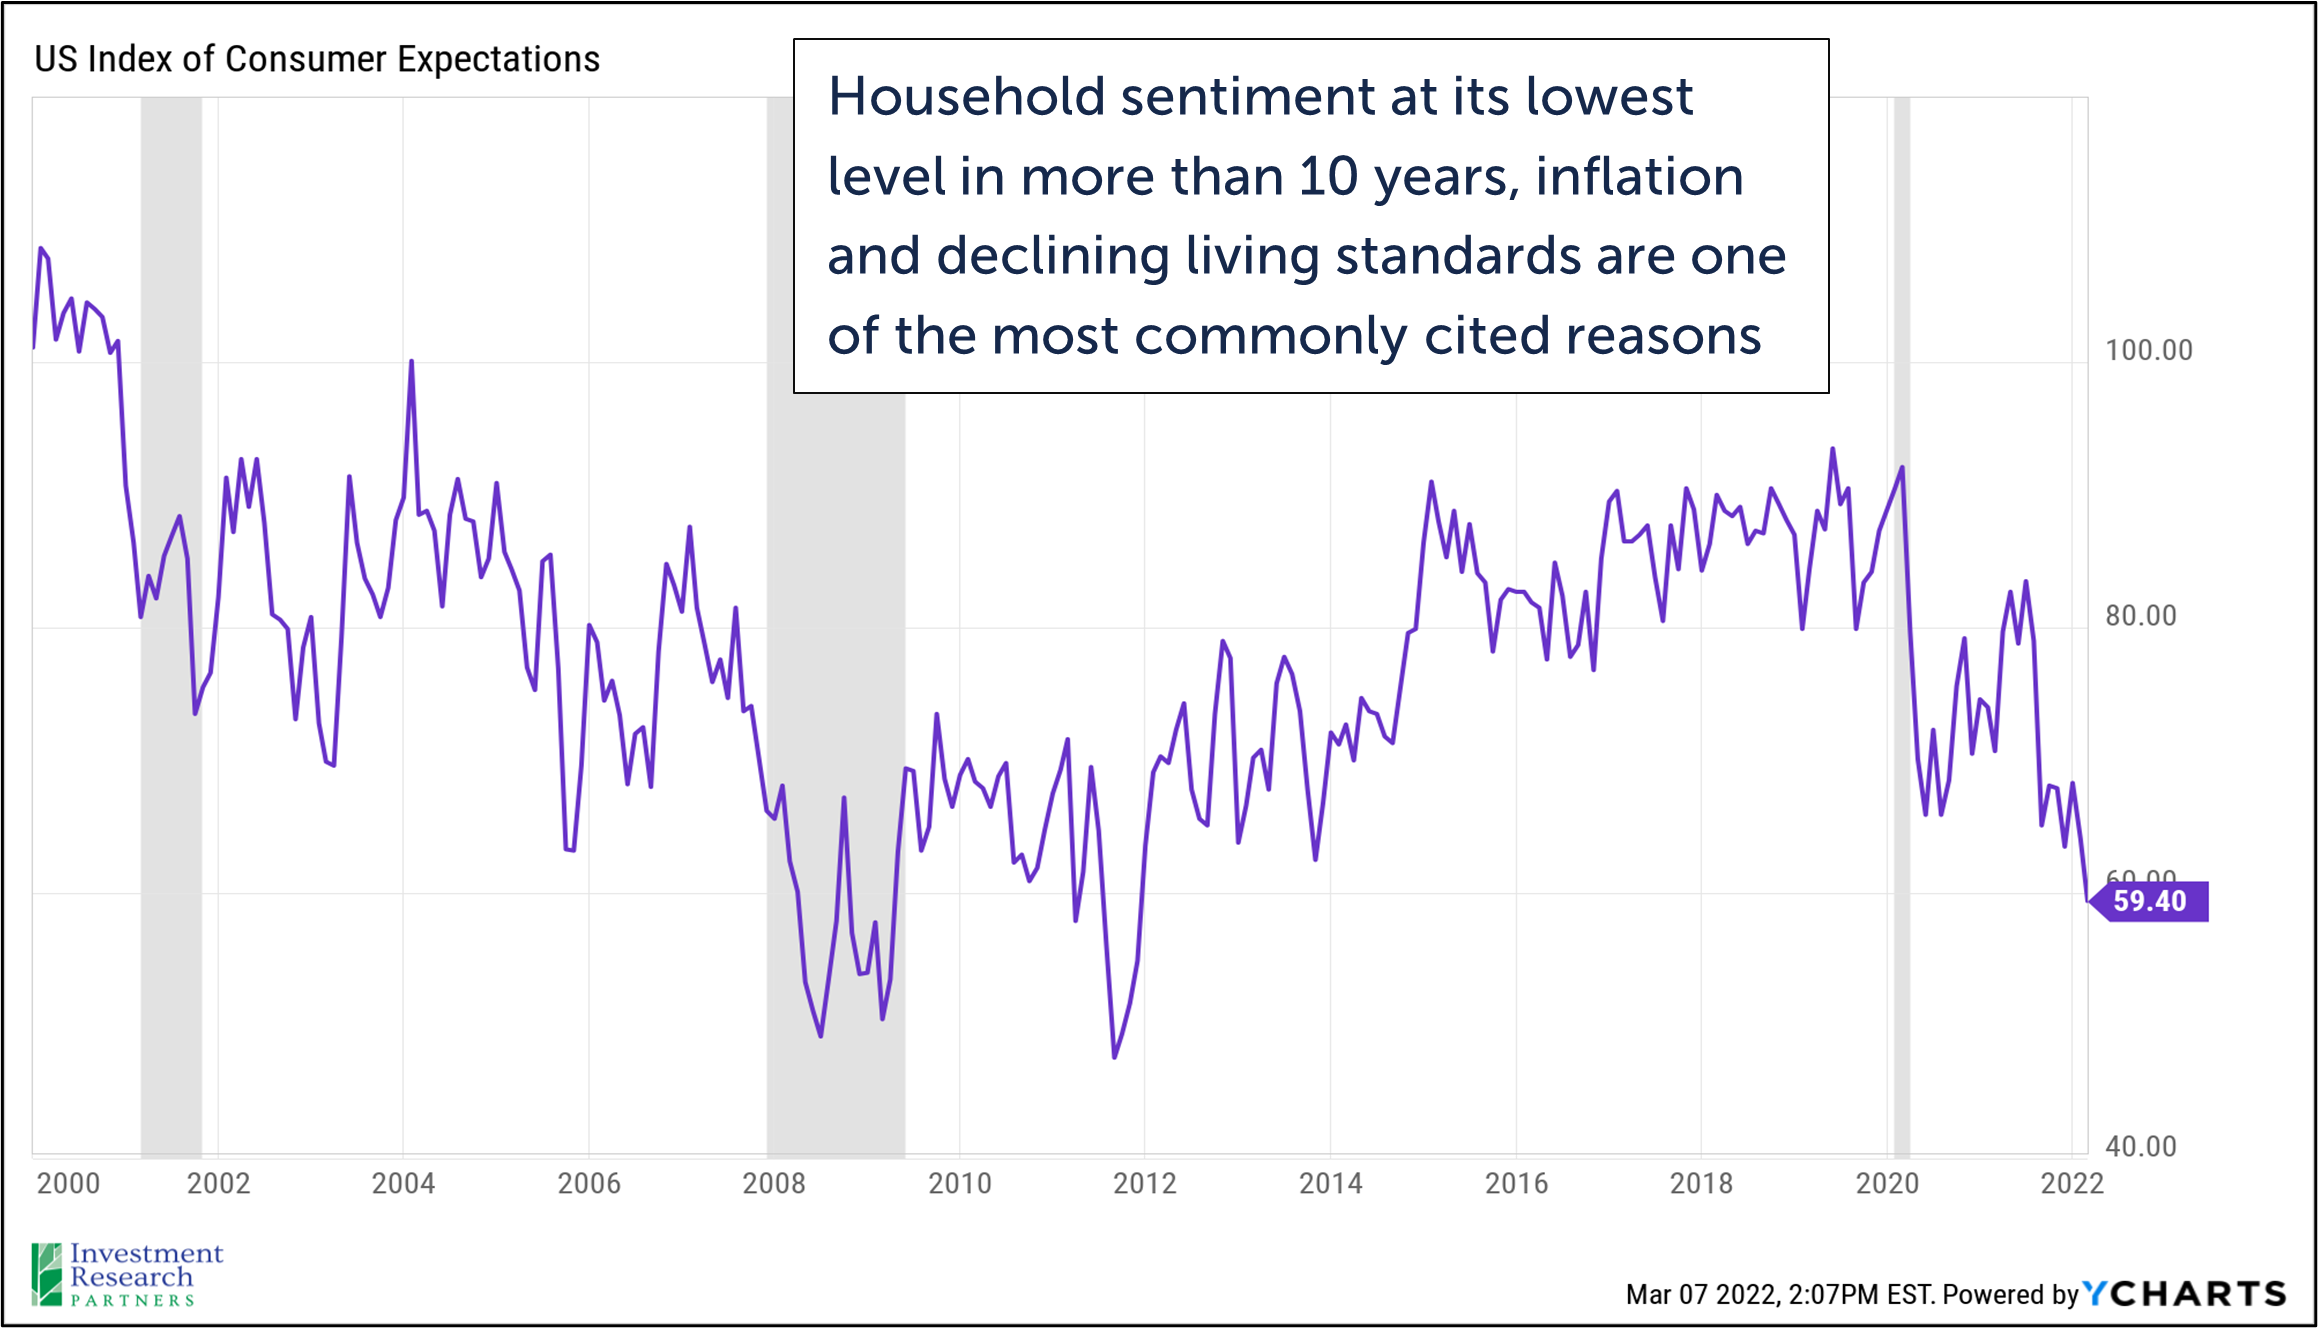
Markets continued to decline in February, with the S&P 500 falling another 3% during the month and continuing to decline during the first few days of March resulting in a 9% year-to-date loss for the index as of March 4, 2022. Oil prices have risen more than 50% this year on top of the 50%+ advance witnessed in 2021. National average gasoline prices have topped $4 per gallon, nearly double the cost to start 2021.[1] The spike in energy prices comes at a precarious time for the US economy when inflation has already been draining household savings and sentiment, and the rise in prices has pushed the US Federal Reserve toward a position of normalizing monetary policy (i.e., raising interest rates) faster than they may have wanted.
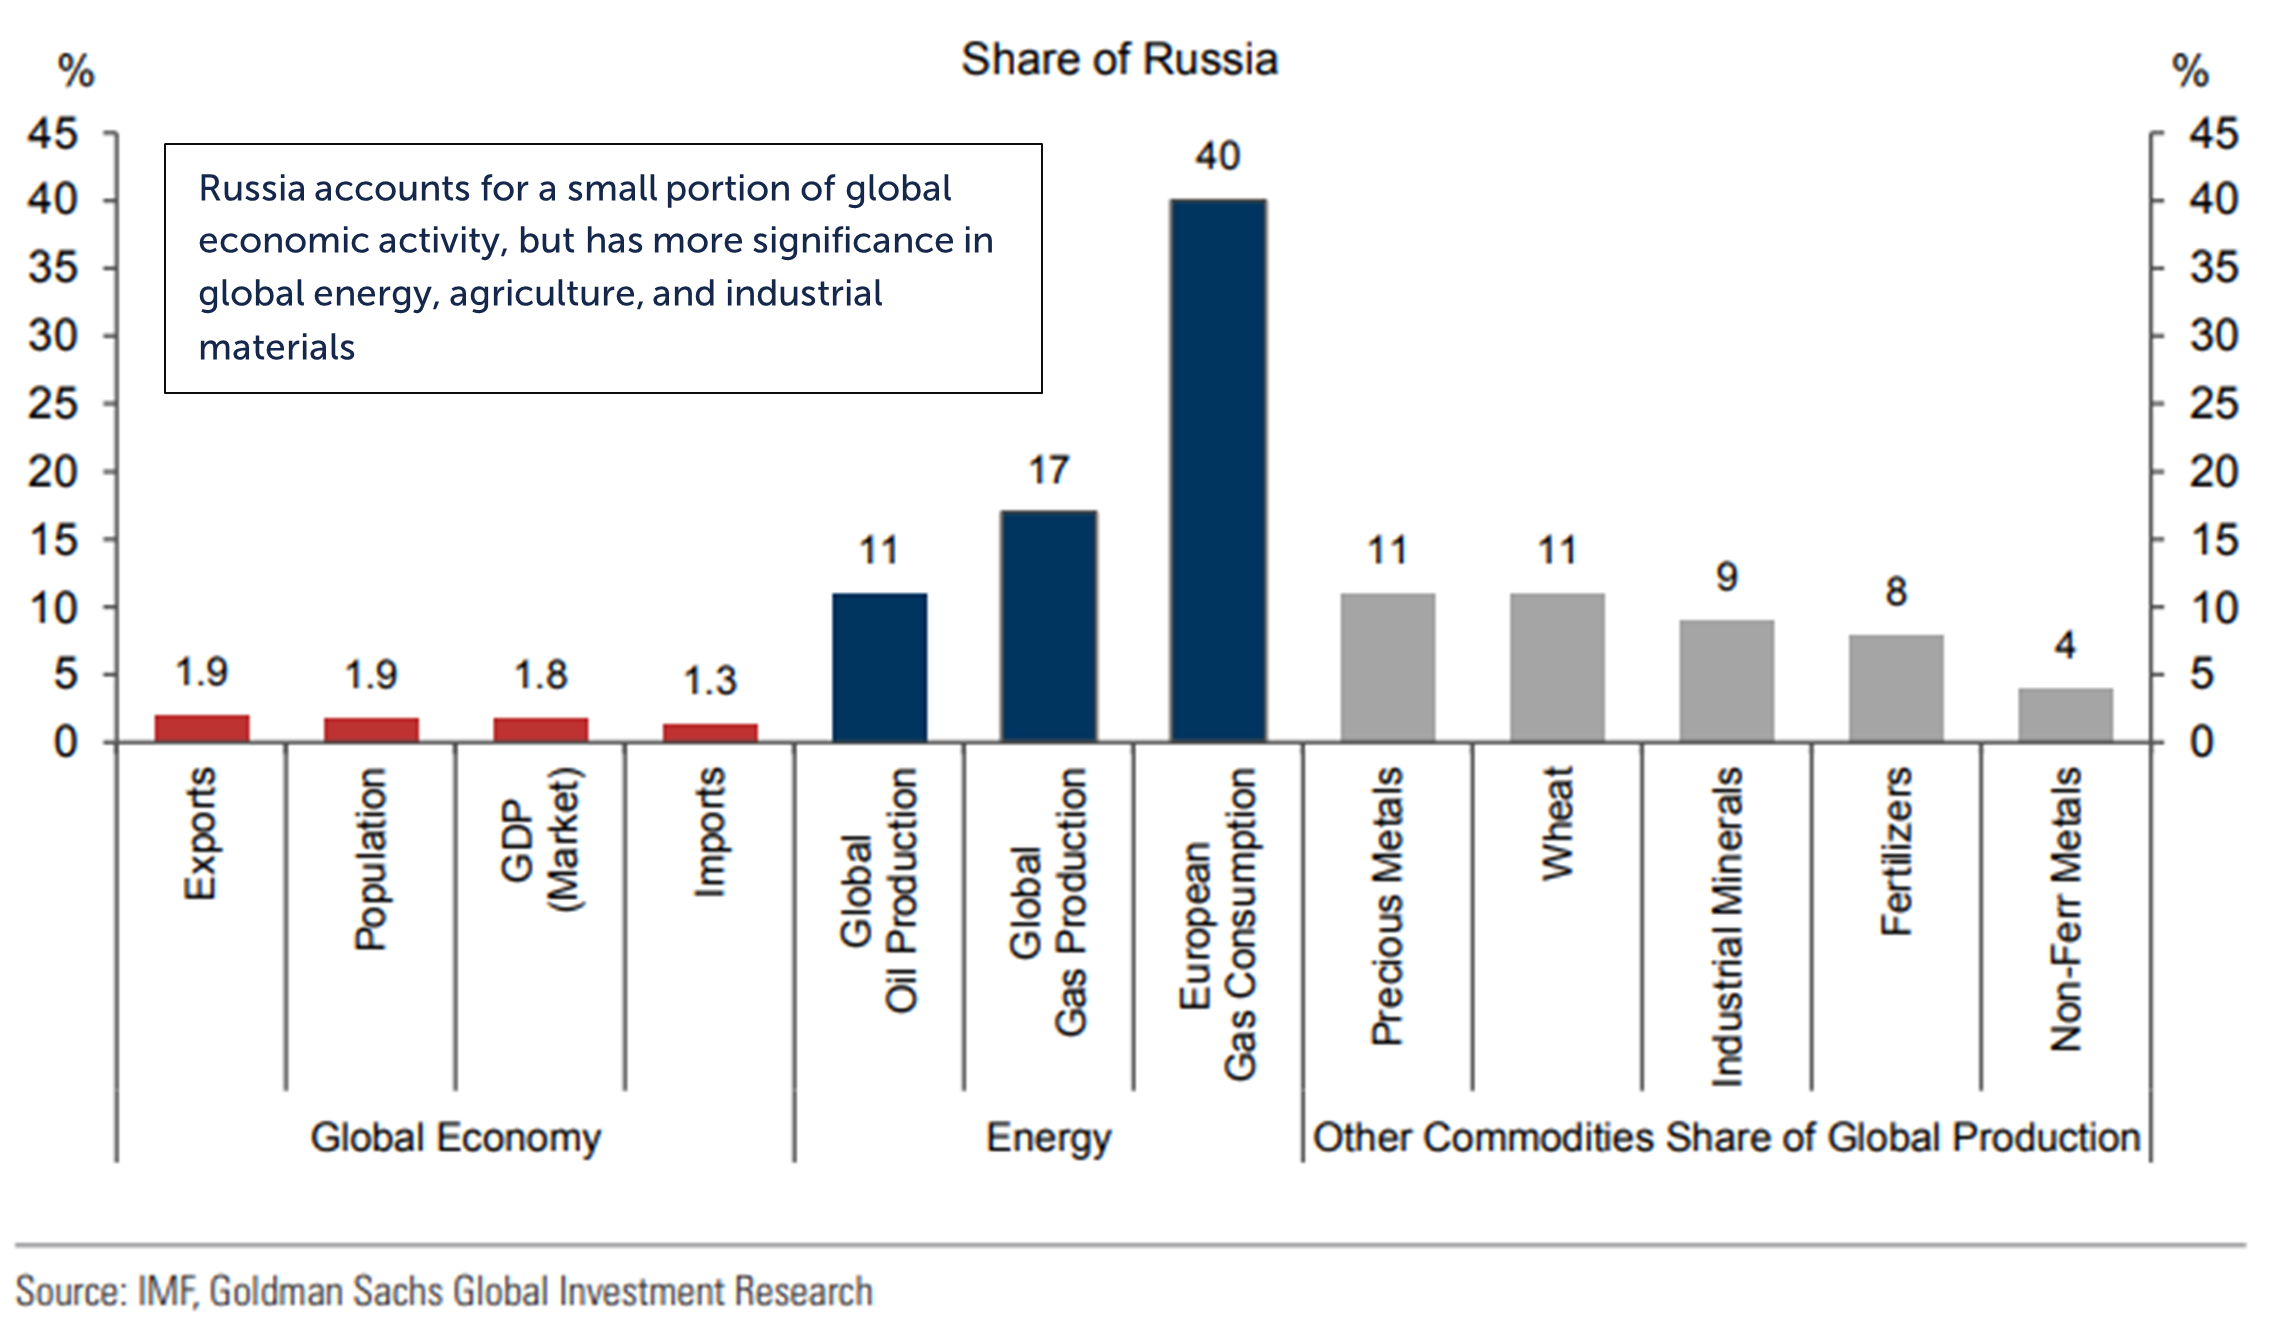
The confluence of forces at play today across geopolitics, monetary policy, and asset prices can be bewildering for investors, and the urge to take cover may be setting in. We will attempt to untangle all the forces impacting investment markets, with the caveat that no human, other than Vladimir Putin, knows what Vladimir Putin will do at this point. To put the Russian economy in context, it accounts for roughly 2% of total global economic activity and 11% of global oil production, as well as 11% each of precious metals and wheat production.[2] Assuming the western world bans the import of these goods, it is logical that prices should rise, particularly in the shorter-term, and will further exacerbate the global supply chain disruptions created by the COVID-19 pandemic. Assuming the military element of the Russia / Ukraine conflict does not spread beyond those countries, we view the factors below as key to the direction of the US and global economies.
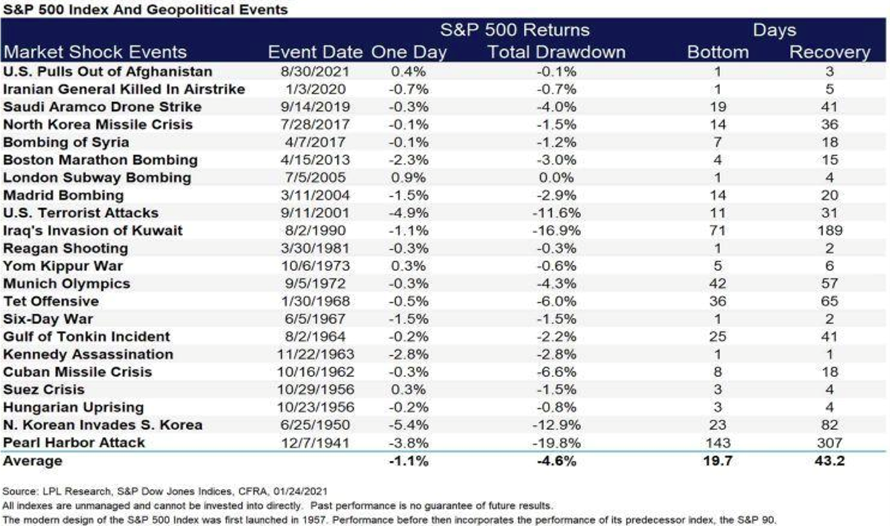
The chart immediately below highlights how the S&P 500 has performed in the face of significant geopolitical events (some being more similar to Russia / Ukraine than others). For long-term investors, we believe that now is not the time to sell, despite the storm clouds on the horizon. We believe that 2022 will be a year of economic rebalancing, though we do not yet see evidence of a recession. During the volatility of 2022, we have been carefully monitoring asset classes and sectors that may be presenting attractive entry points for long-term gains. With the significant geopolitical uncertainty, we do not yet feel comfortable giving the “all clear” signal, but a market recovery could come swiftly if the Russia / Ukraine conflict cools. We advocate that investors work with their financial advisor to revisit their long-term goals and tolerance for investment risk as it is healthy to understand your investing disposition in both good times and bad in order to provide more steadiness and clarity for the next eventual bout of market volatility.
 |
|
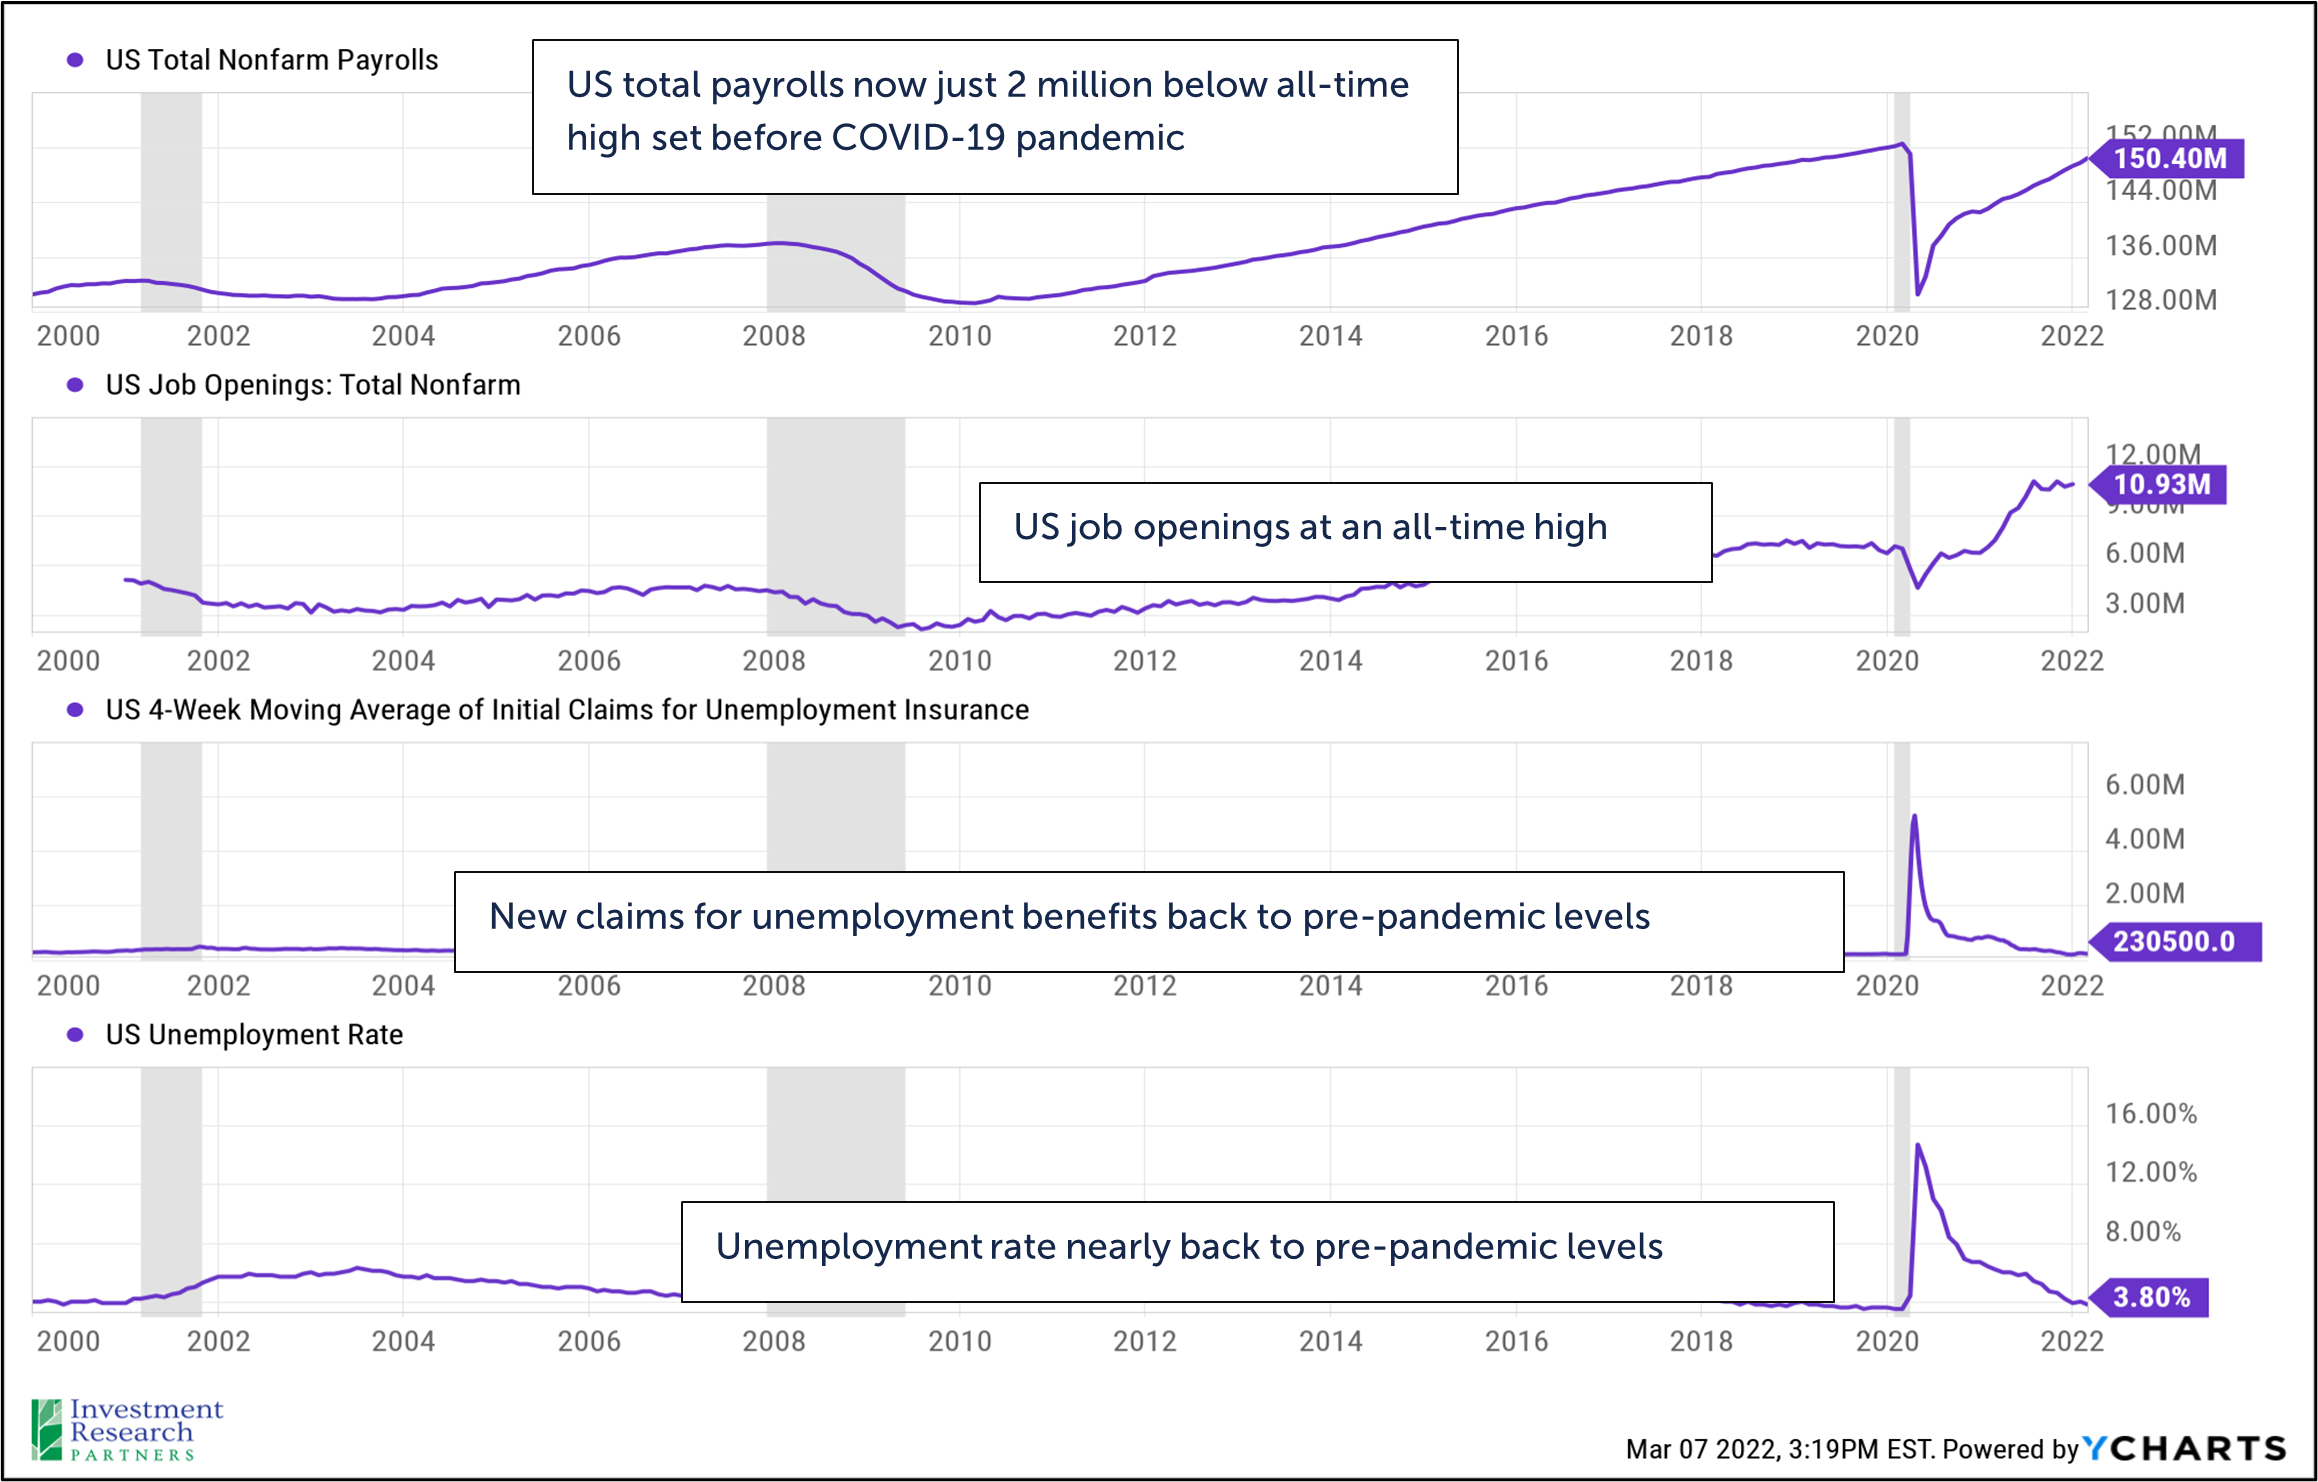
The Bureau of Labor Statistics announced that the US economy added 678,000 jobs in February and the unemployment rate declined to 3.8%, outperforming a consensus estimate of economists. The gains were led by the leisure and hospitality industries (179,000 jobs added), which is not surprising given the significant decline in new COVID-19 cases and the anticipation of warmer weather in the US. Federal Reserve Chair, Jerome Powell, said last year that the US Central Bank did not expect to raise interest rates until employment reached pre-pandemic levels. As the Fed is expected to raise interest rates by at least 0.25% at its March 15-16th meeting, the move would be reasonably timed given Powell’s previous comments given that total US nonfarm payrolls are now just 2 million jobs below their pre-pandemic high.
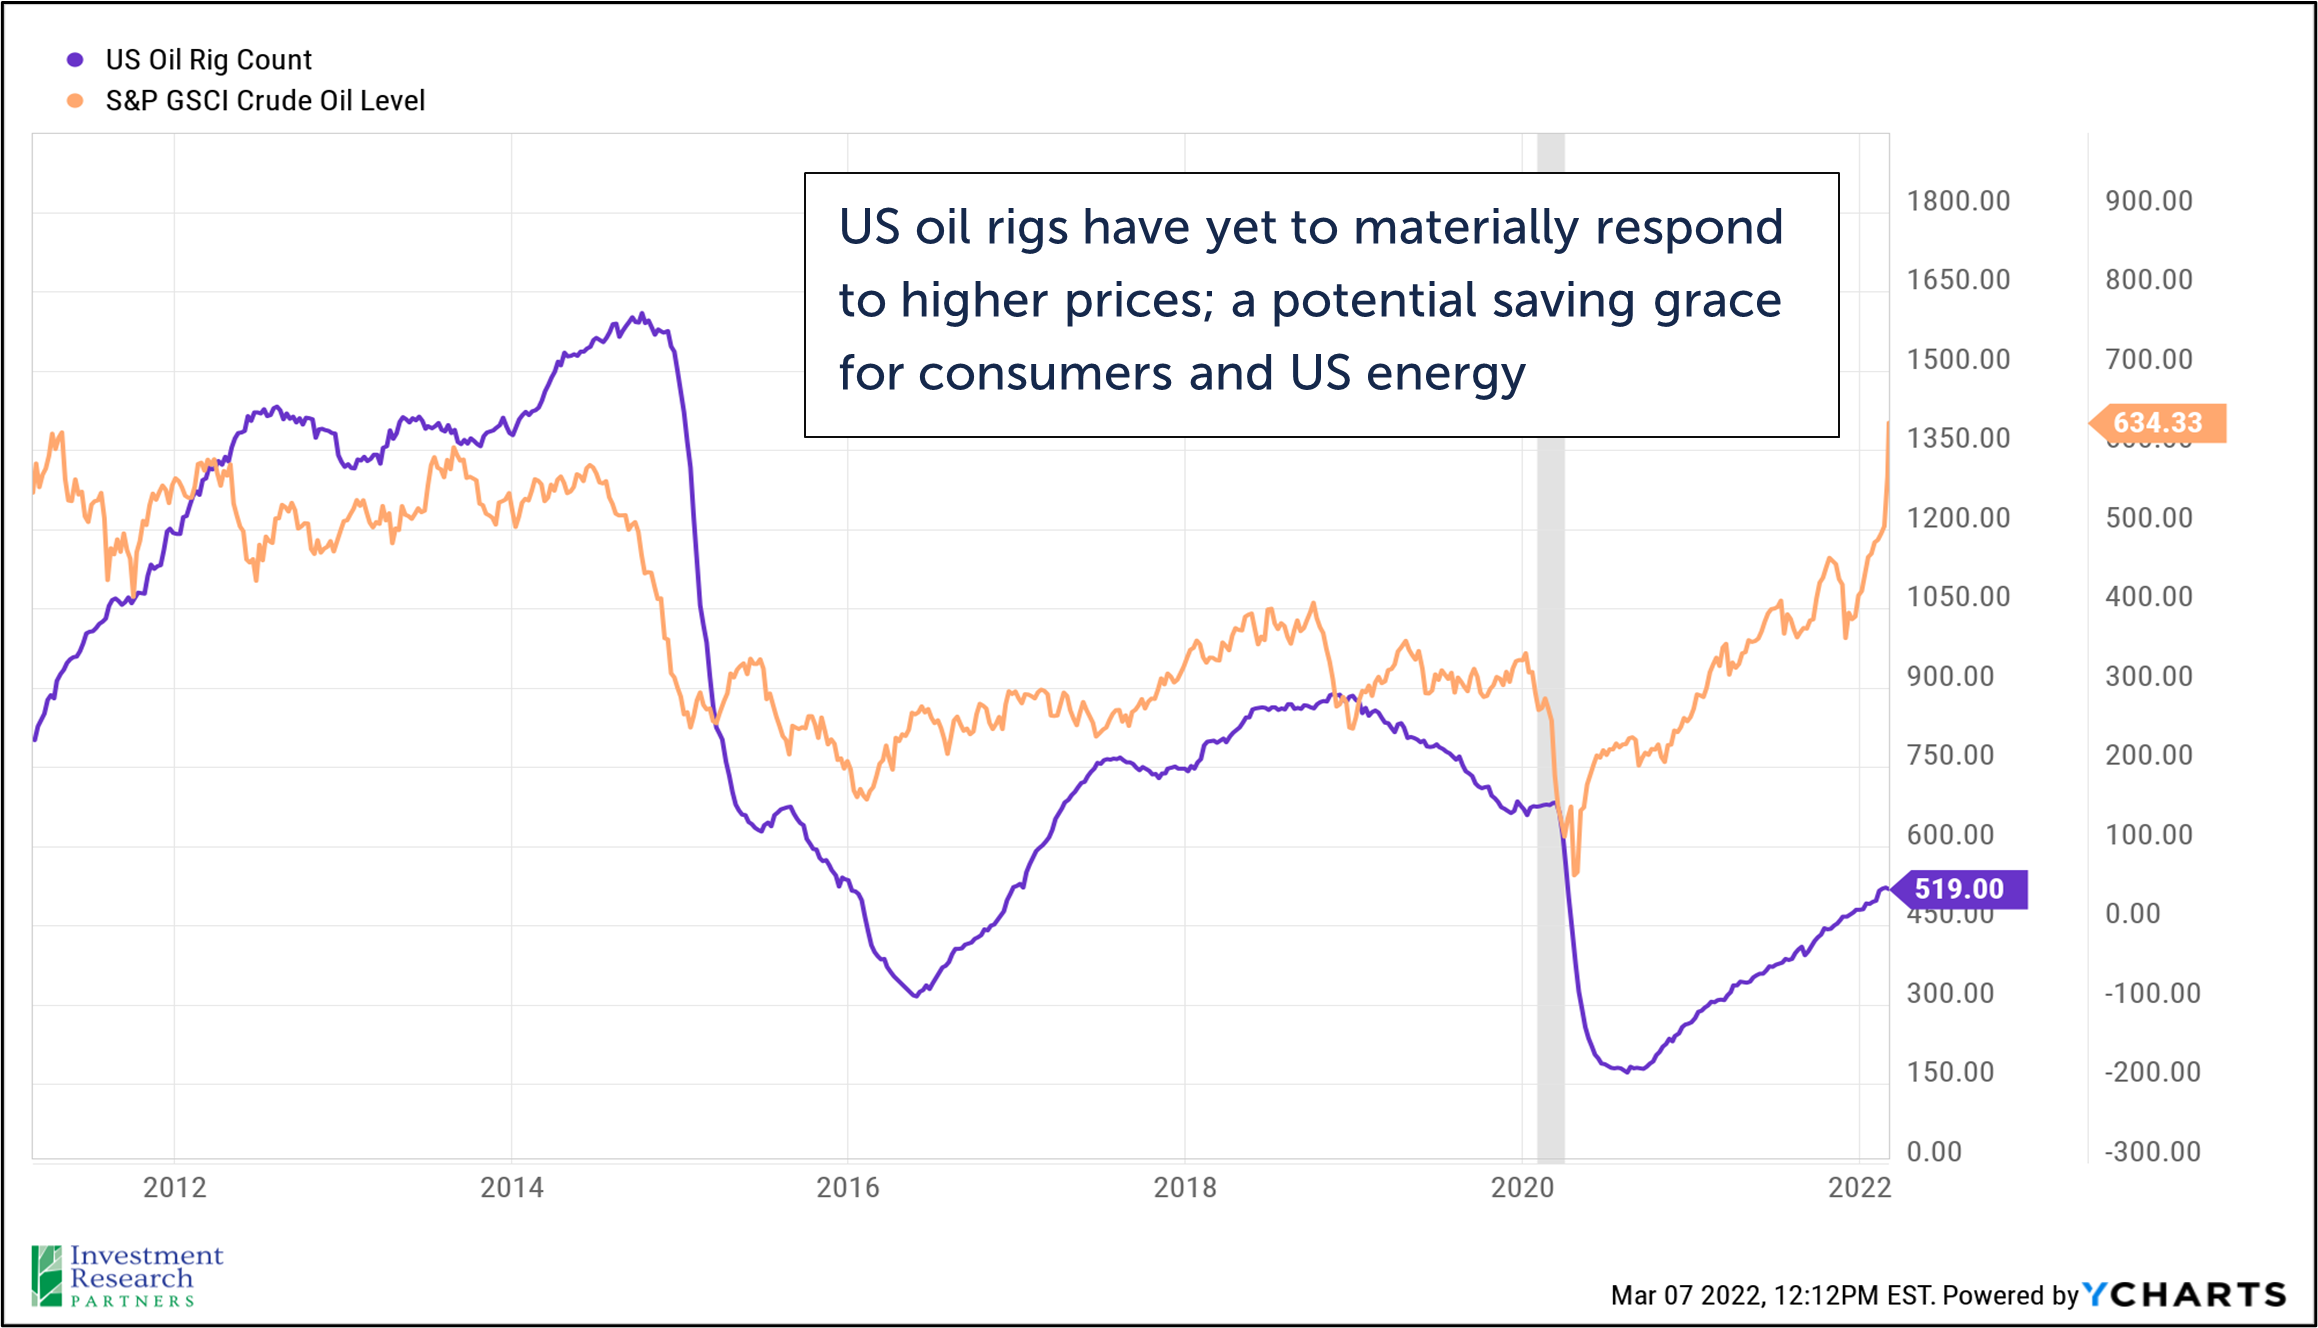
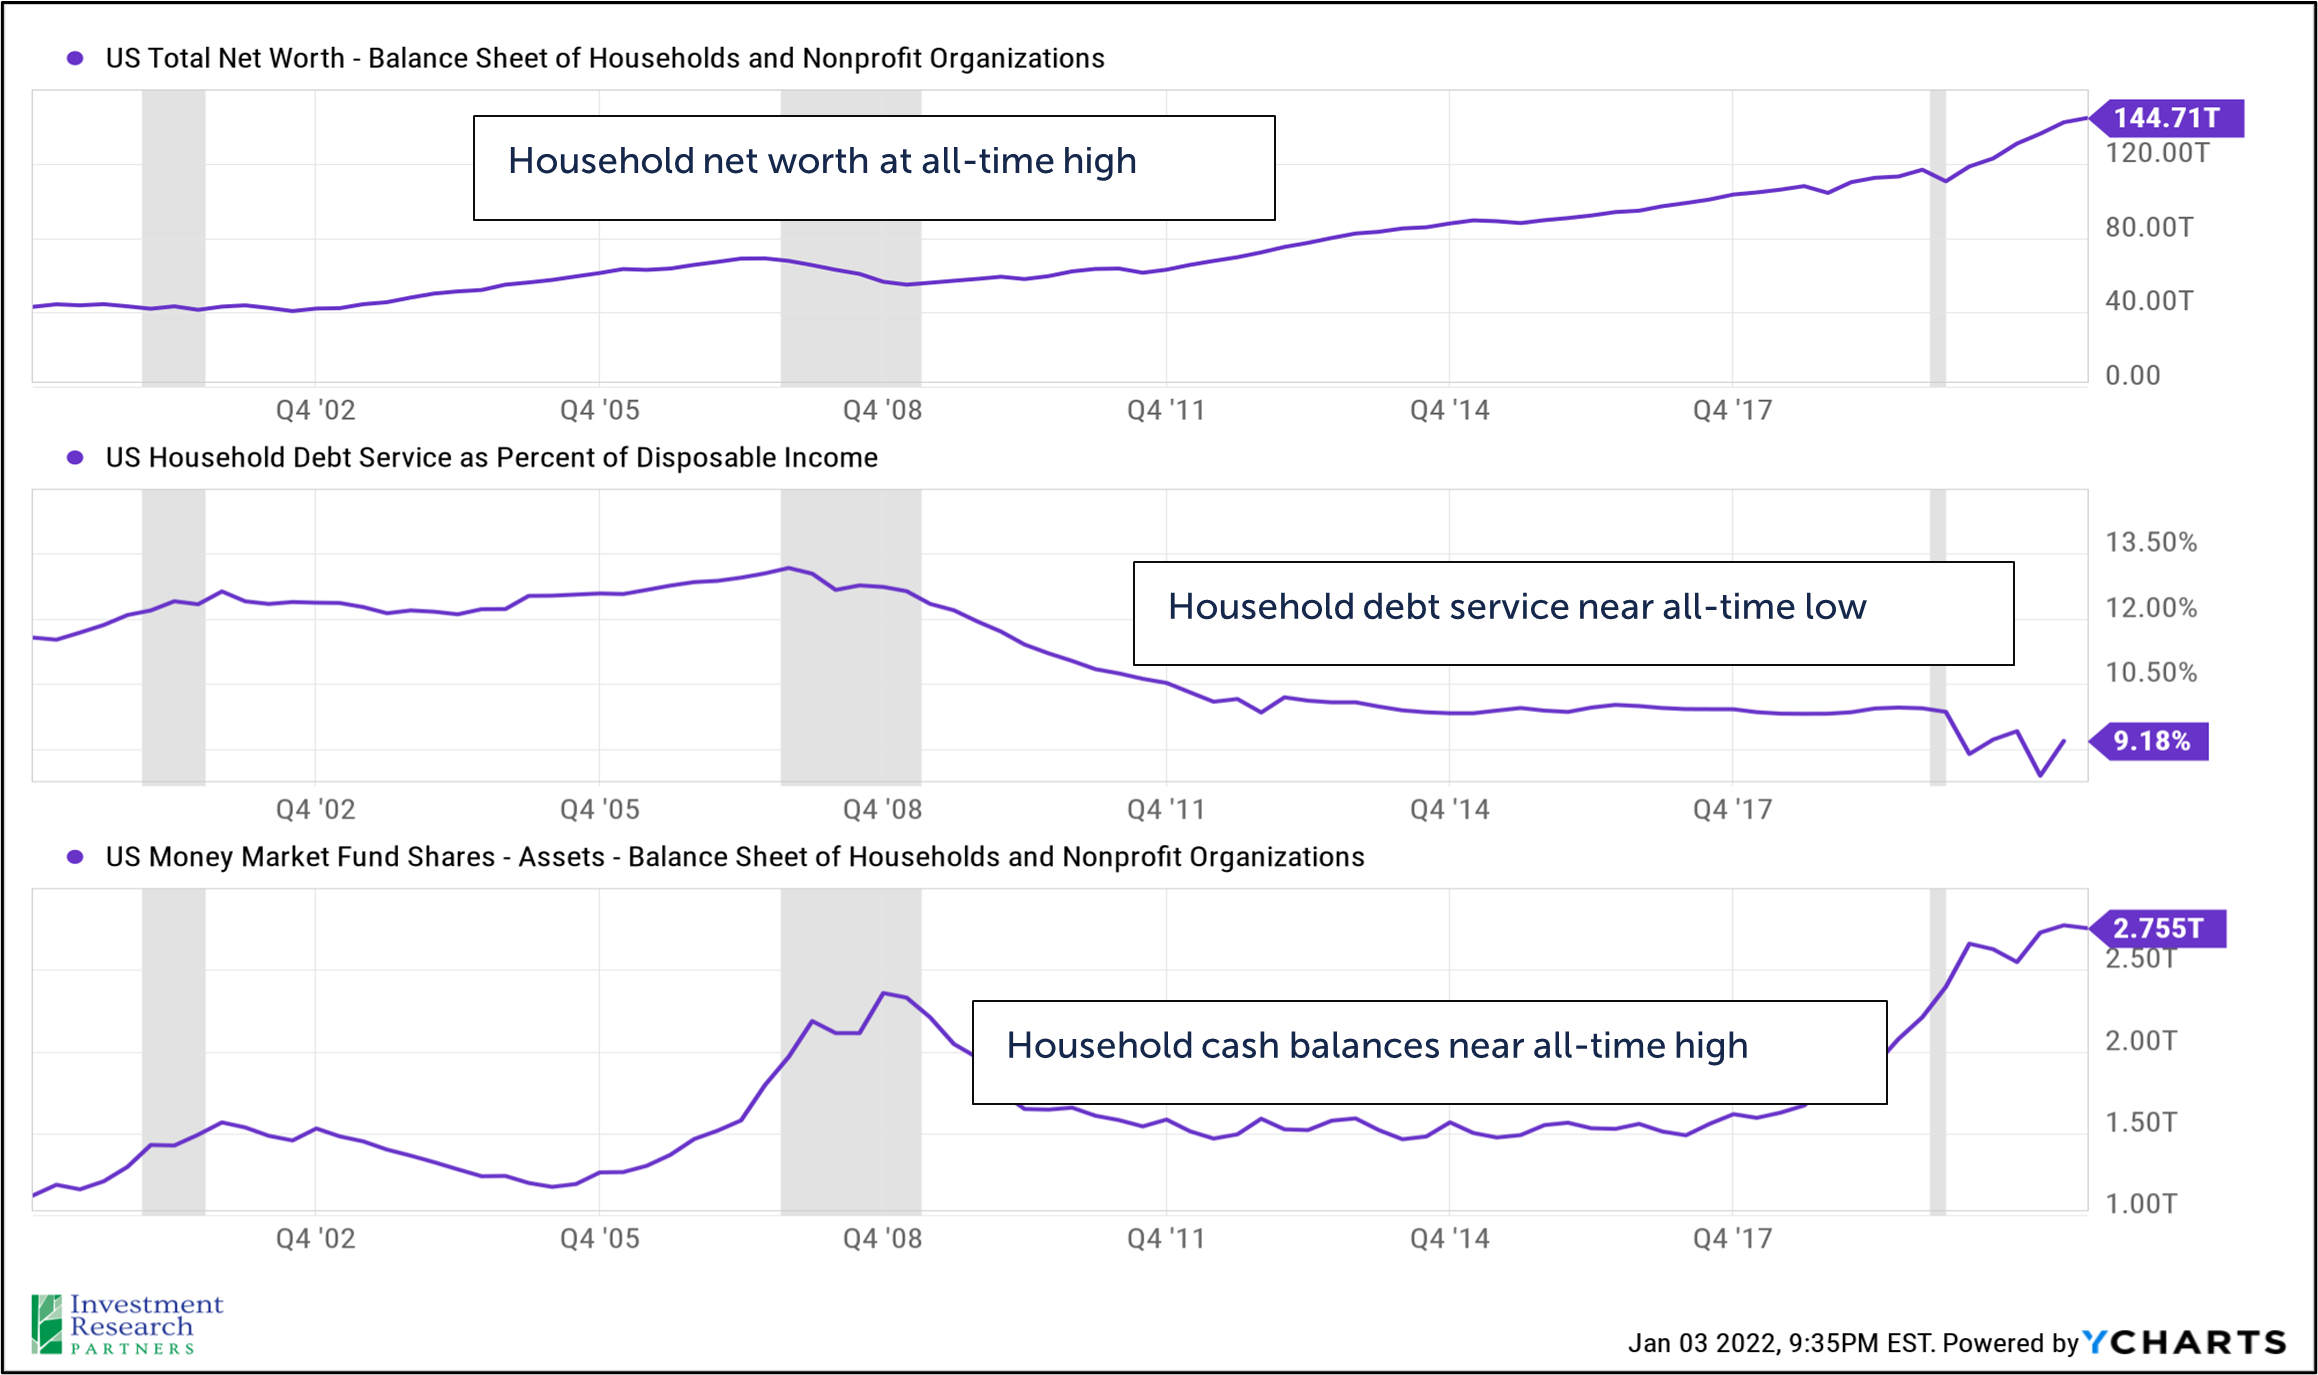
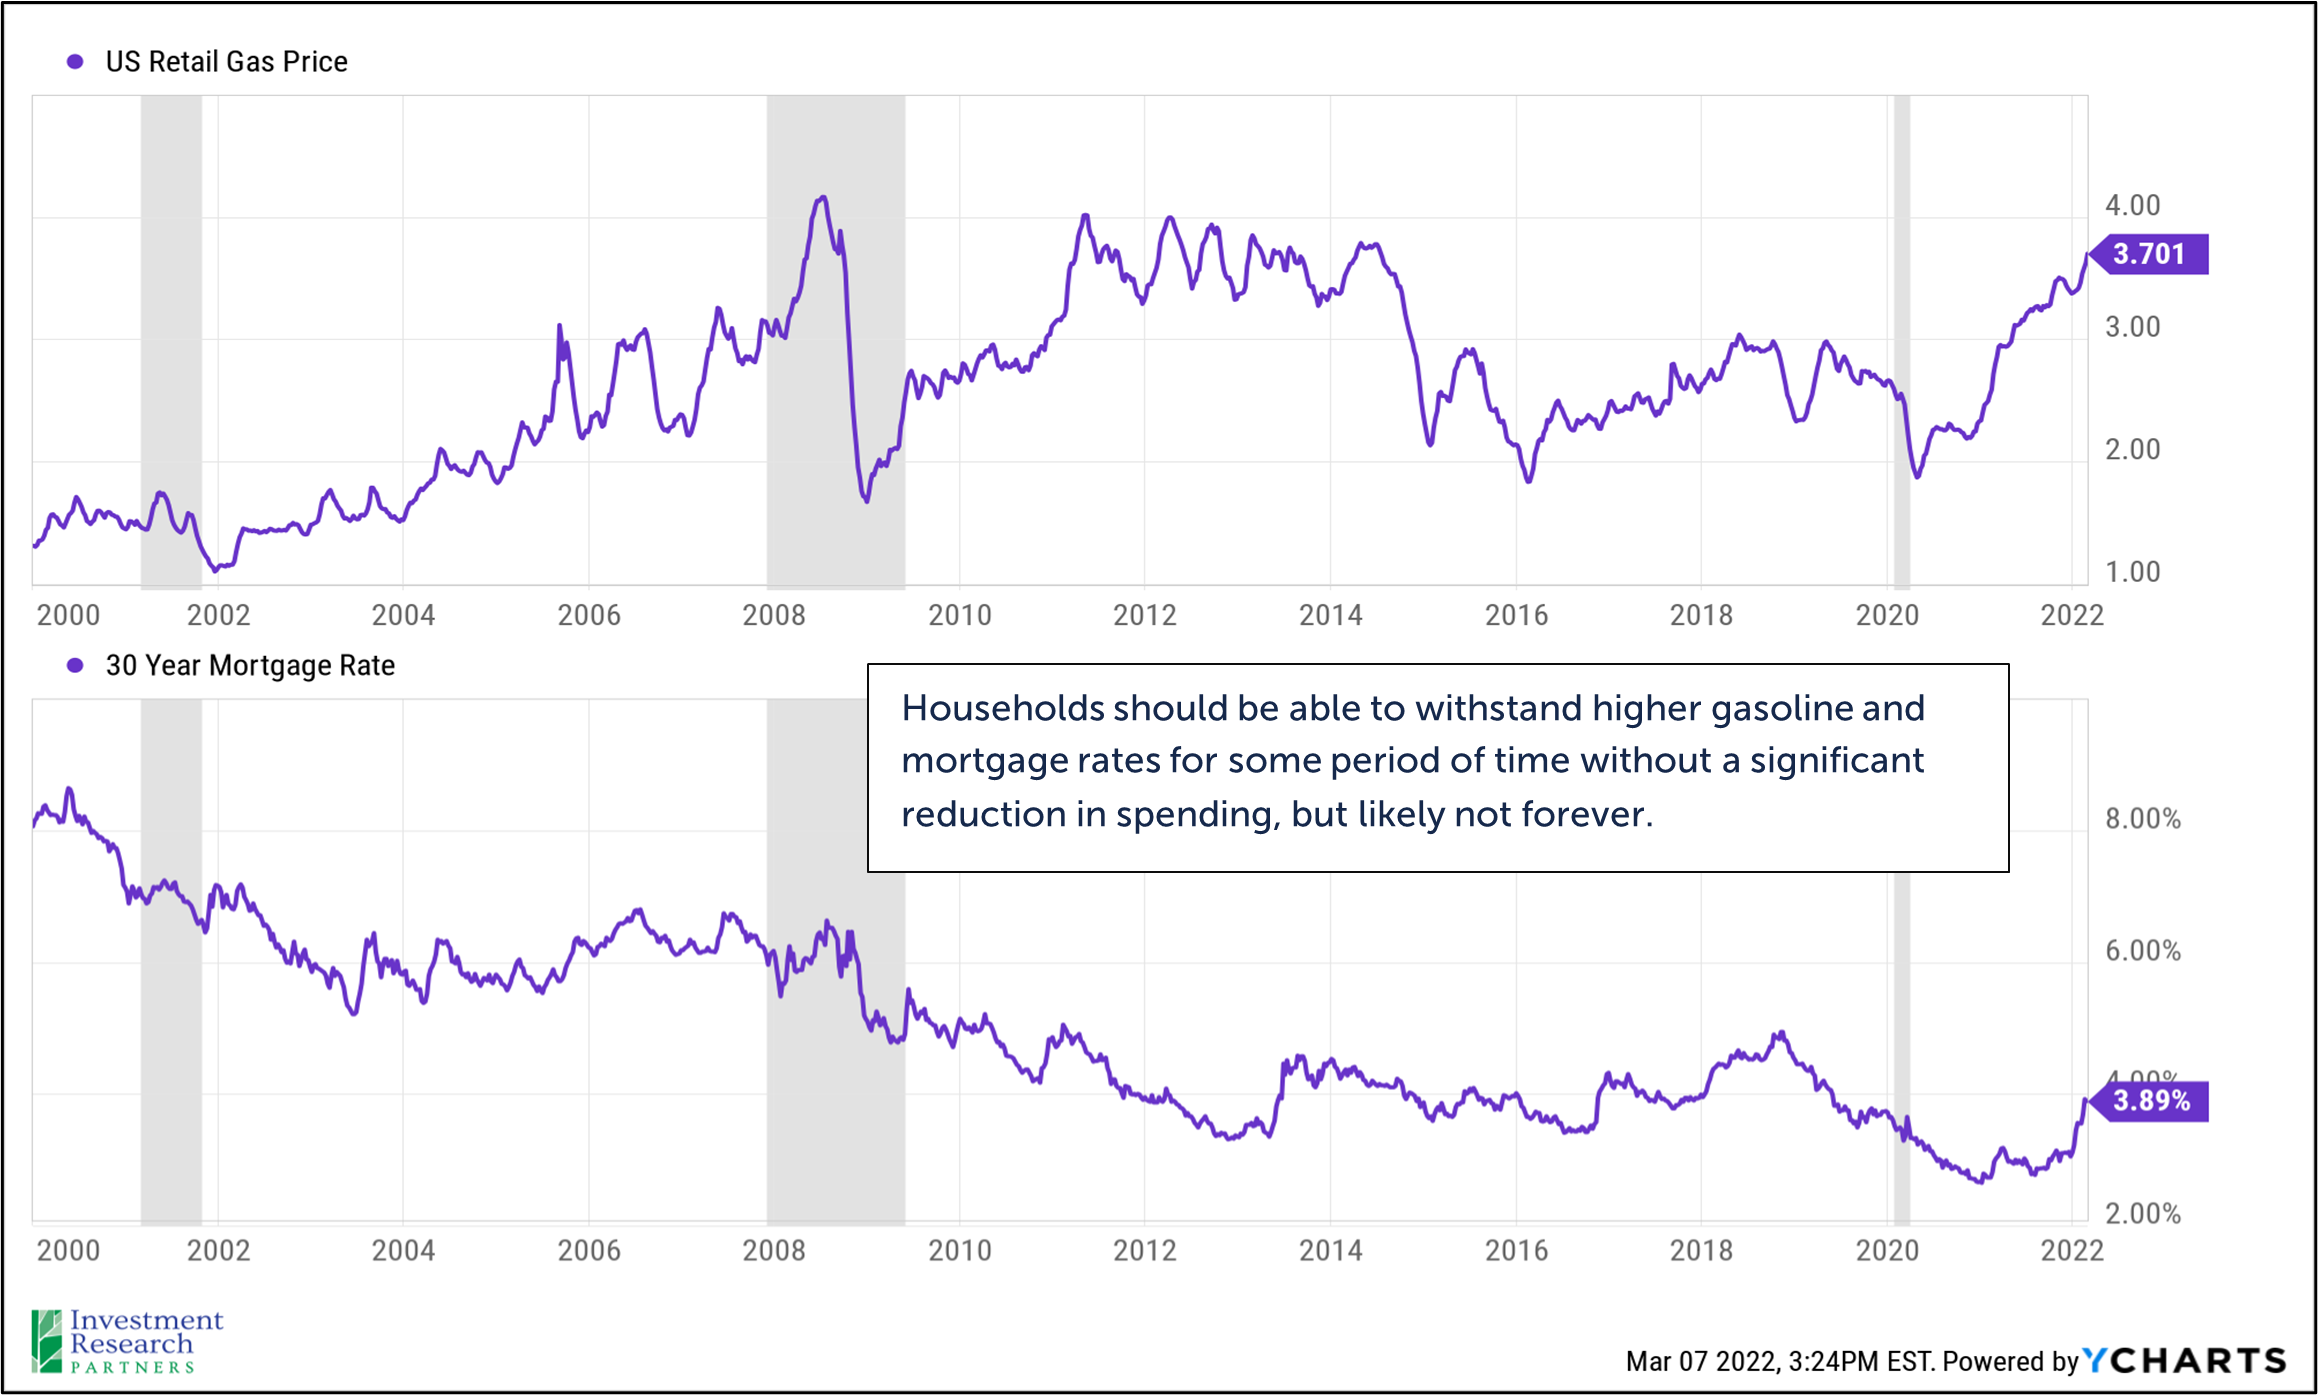
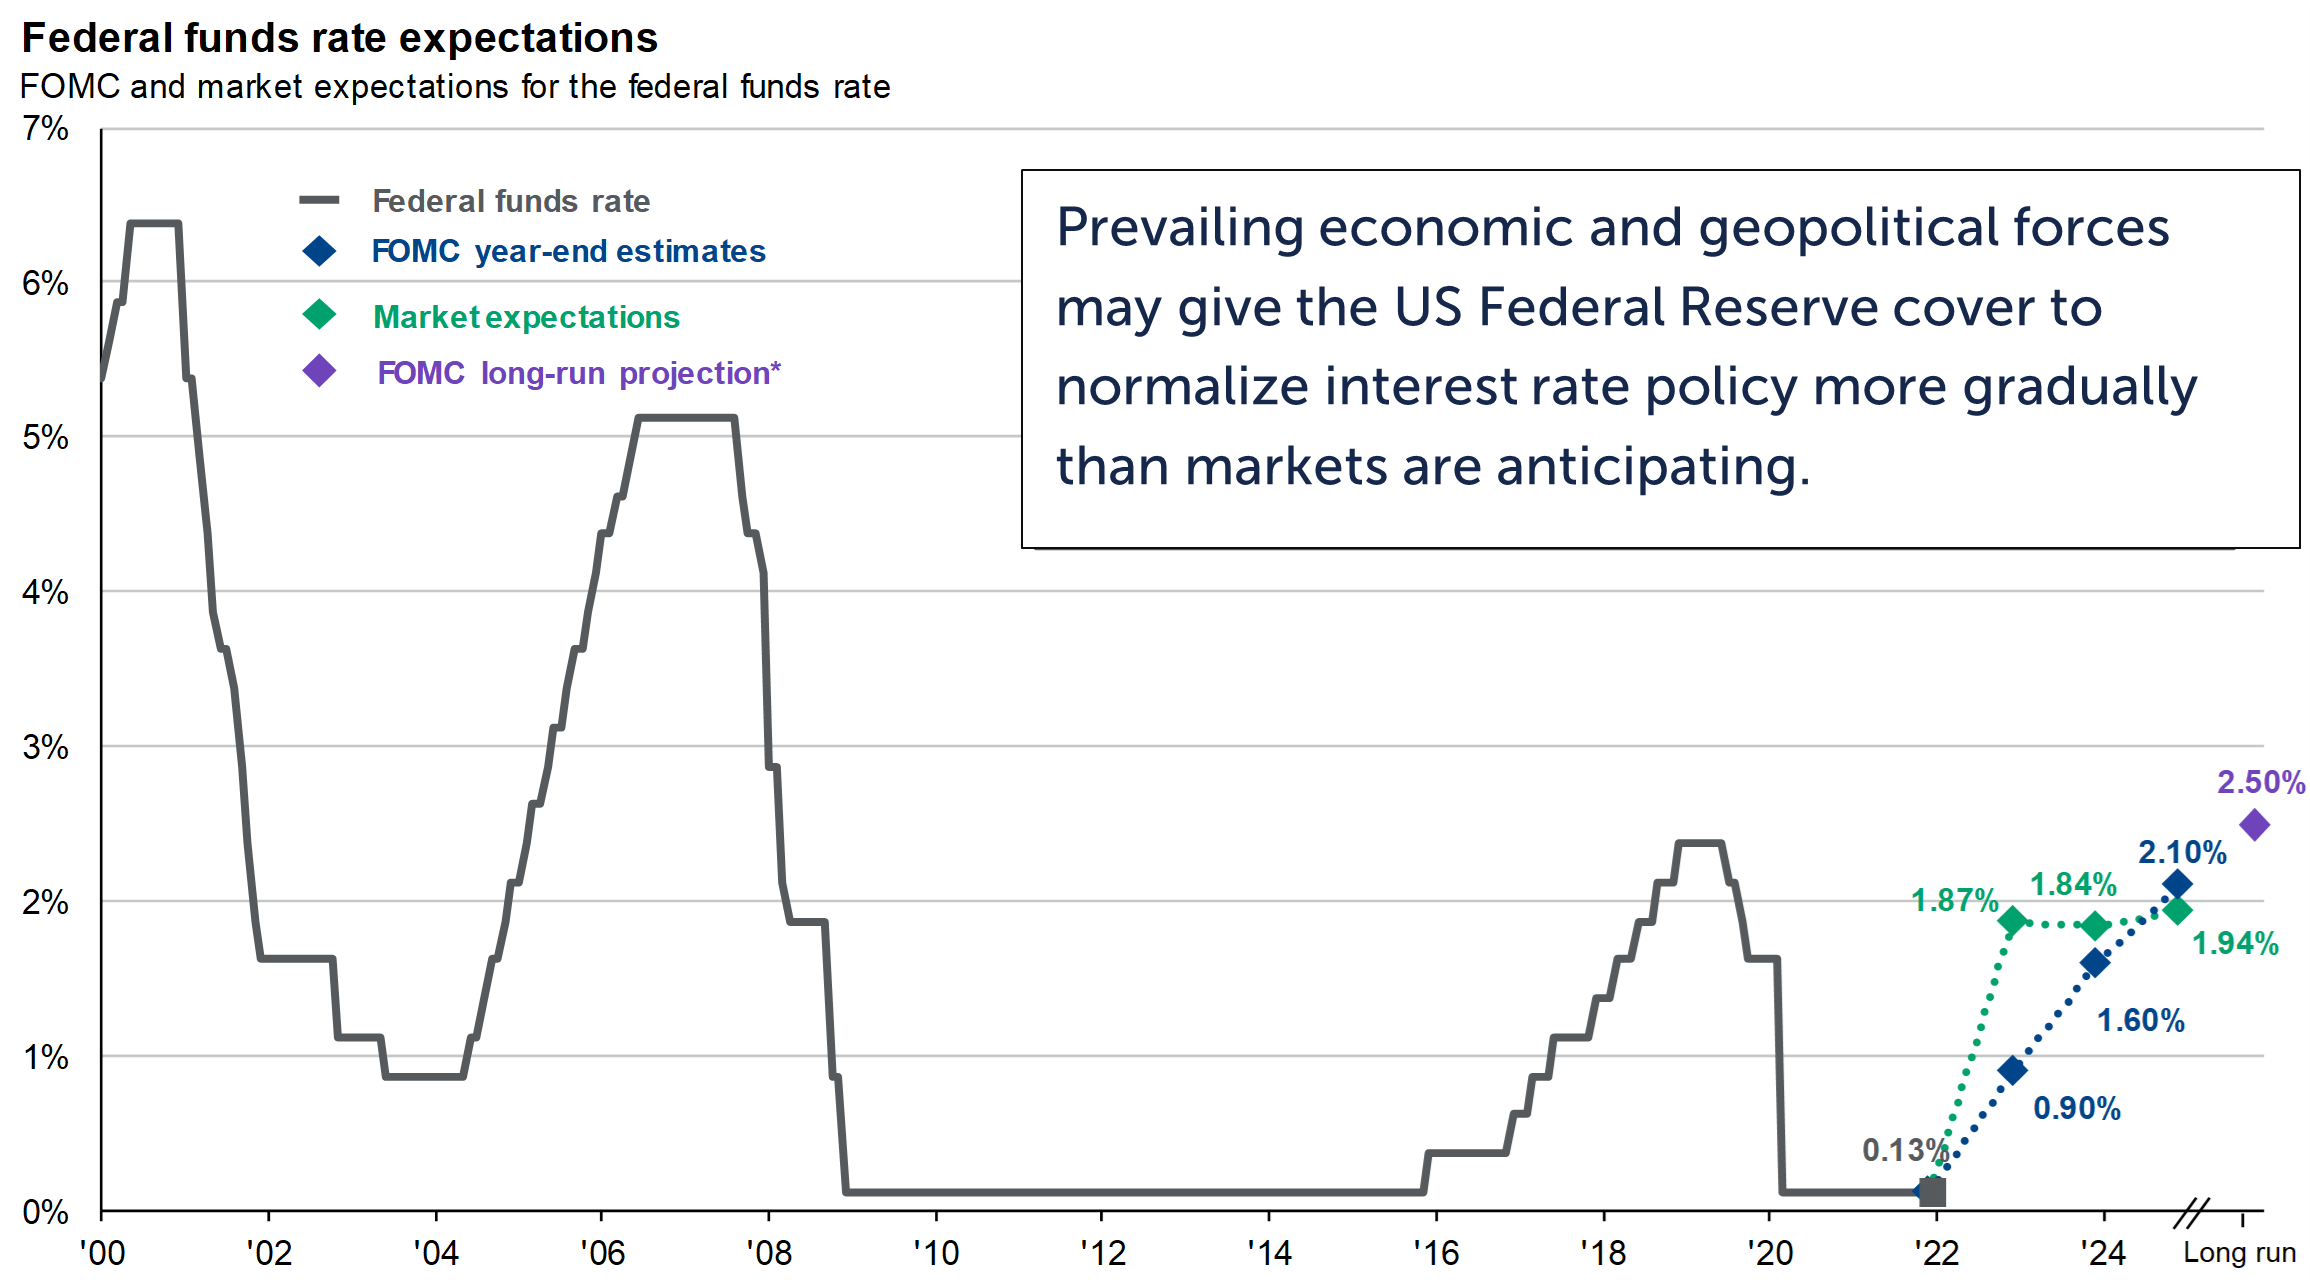
Mortgage rates have already moved meaningfully higher in anticipation of the Fed’s path while at the same time the energy price spike stemming from the Russia / Ukraine conflict has meaningfully increased gasoline prices (amongst nearly all other energy-related inputs to US activity). Households are going into these challenges in good financial shape and should be able to weather the storm for some time. Higher energy and borrowing costs should serve to dampen consumption, which in turn should cool inflation and potentially give the Fed some cover to raise interest rates more gradually than market participants are currently anticipating. April’s reports of Q1 earnings will be a significant test for markets to determine if consumers have slowed spending and / or rising input costs have sapped company profitability.
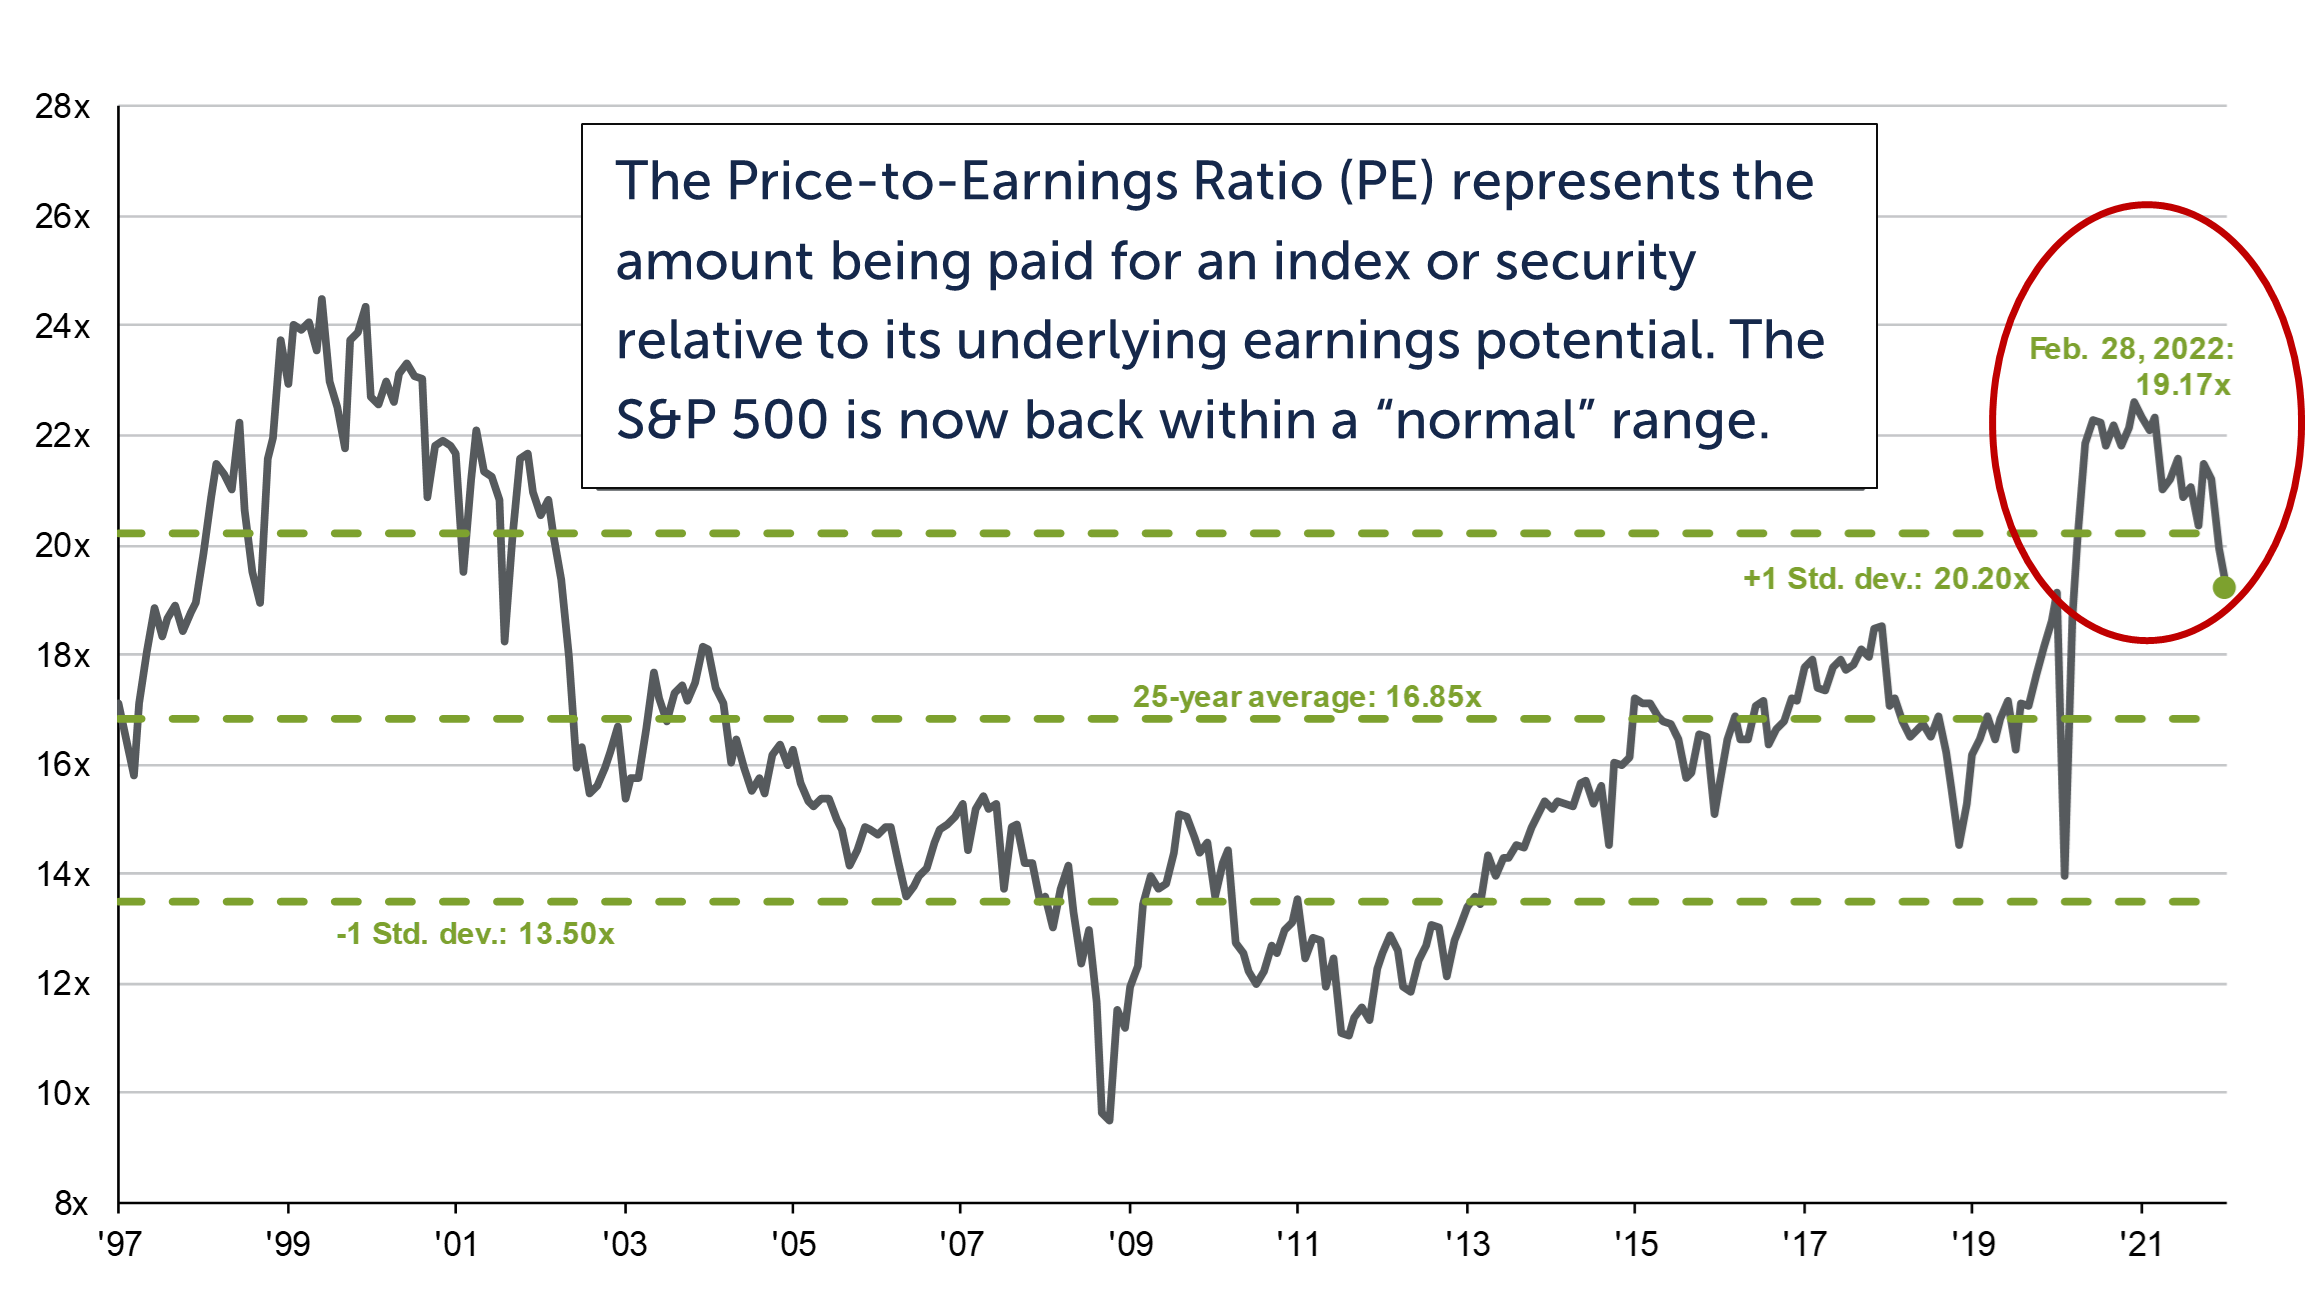
Market declines in 2022 have pushed the valuation of broad stock and bond indices back toward long-term average levels. However, the index had become historically top-heavy in high growth companies such as Tesla and Nvidia. The index itself has become reasonably more attractive relative to a year ago, but we continue find opportunities within sectors, industries, and companies beneath the surface. Opportunities typically consist of assets beyond those found in the S&P 500, such as foreign and small cap equities.
S&P 500 Price-to-Expected Earnings
 |
Top 10 holdings of the S&P 500 now represent nearly the largest share of the index in history. So, index averages don’t tell the complete story of the potential underlying opportunity.
|
Our technical analysis of markets involves multiple tools that seek to identify buy / sell signals and trends across various asset classes and securities. In January, many parts of the market that had been in strong upward trends for nearly two years, such as technology stocks, broke down. This breakdown has been further exacerbated by the Russia / Ukraine conflict (with the expectation of perhaps commodities which are in a very strong uptrend). We are now looking for signs of a “bottoming process”, which simply means that selling is no longer overwhelming buying of a particular asset or asset class, and a new uptrend may be emerging.
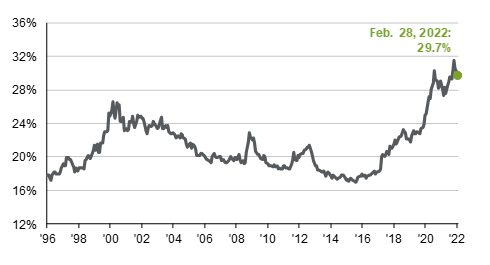
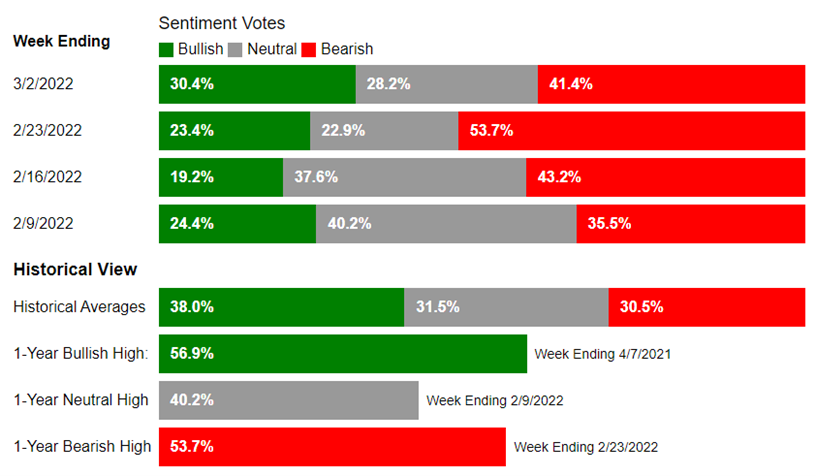
Since 1987, The American Association of Individual Investors (AAII) has been asking its members the same question every week: “What direction will the stock market be in the next six months?” The results are compiled into bulls, neutral, and bears. Extreme bullishness or bearishness have often represented useful contrarian signals for investors (reminiscent of Warren Buffet’s famous quote - “be greedy when others are fearful, and fearful when others are greedy”). It is potentially concerning that despite such significant turmoil and upheaval in geopolitics and markets that investors remain fairly neutrally balanced in their view. We typically watch for a washout in investor sentiment in order to help confirm that a market bottom may be forming.
Prices & Interest Rates
| Representative Index | February 2022 | Year-End 2021 |
|---|---|---|
| Crude Oil (US WTI) | $95.72 | $75.21 |
| Gold | $1,899 | $1,828 |
| US Dollar | 96.71 | 95.97 |
| 2 Year Treasury | 1.44% | 0.73% |
| 10 Year Treasury | 1.83% | 1.52% |
| 30 Year Treasury | 2.17% | 1.90% |
| Source: Morningstar, YCharts, and US Treasury as of February 28, 2022 |
Asset Class Returns
| Category | Representative Index | February 2022 | YTD 2022 |
|---|---|---|---|
| Global Equity | MSCI All-Country World | -2.6% | -7.4% |
| Global Equity | MSCI All-Country World ESG Leaders | -3.2% | -13.2% |
| US Large Cap Equity | S&P 500 | -3.0% | -9.0% |
| US Large Cap Equity | Dow Jones Industrial Average | -3.3% | -9.4% |
| US All Cap Equity | Russell 3000 Growth | -4.0% | -18.2% |
| US All Cap Equity | Russell 3000 Value | -1.0% | -5.7% |
| US Small Cap Equity | Russell 2000 | 1.1% | -13.0% |
| Foreign Developed Equity | MSCI EAFE | -1.8% | -6.5% |
| Emerging Market Equity | MSCI Emerging Markets | -3.0% | -4.8% |
| US Fixed Income | Bloomberg Barclays Municipal Bond | -0.4% | -3.5% |
| US Fixed Income | Bloomberg Barclays US Agg Bond | -1.1% | -3.3% |
| Global Fixed Income | Bloomberg Barclays Global Agg. Bond | -1.2% | -4.0% |
| Source: YCharts as of February 28, 2022 | |||
[1] Source: YCharts
[2] Source: Goldman Sachs
[3] Source: YCharts and Michigan Survey of Consumers
Download PDF Version
Past performance may not be representative of future results. All investments are subject to loss. Forecasts regarding the market or economy are subject to a wide range of possible outcomes. The views presented in this market update may prove to be inaccurate for a variety of factors. These views are as of the date listed above and are subject to change based on changes in fundamental economic or market-related data. Please contact your Financial Advisor in order to complete an updated risk assessment to ensure that your investment allocation is appropriate.