Schedule a Call

Monthly Investment Update: January 2022

January 3, 2022 OneAscent

Happy New Year!

For many investors, 2021 was a year of robust gains with the S&P 500 index returning nearly 29%, but there was significant dispersion in results across industries and geographies. Areas like emerging markets declined 3% as a category as geopolitical risk in China and pandemic-related challenges continued to weigh on these markets. US bonds experienced their first negative calendar year since 2013 after providing approximately 8% annual returns in 2018 and 2019. Energy was the best performing sector in the US, advancing more than 53% during the year as the pace of the economic reopening and subsequent demand for fuel surprised to the upside. And, despite being in the midst of a global pandemic, biotechnology companies as an industry (healthcare companies on the frontlines of seeking cures for diseases) were surprising flat in 2021.[1] The environment for 2022 is setting up to be an exciting one for active investors willing to step beyond simply owning an S&P 500 index fund.

Baseball Hall-of-Famer, Casey Stengel, said, “Never make predictions, especially about the future.” As investors, we are in the business of making observations and allocating capital accordingly, but typically with much longer time horizons than an individual calendar year. Nevertheless, here are areas to watch in 2022:

  1. The “Everything Bubble”
    Global markets are awash in cash. Money market balances among US households and non-profit organizations are near $3 trillion, which provides the potential to fuel demand for stocks, homes, and speculative assets like Bitcoin. Balances in investment accounts and home equity are increasingly linked to household sentiment and economic growth, and central banks know this. They are trapped in a low interest rate world and will need to normalize monetary policy very delicately over multiple years. If they manage to do this without more exogenous shocks (like COVID or major geopolitical unrest), it is conceivable that risk assets may continue their upward trajectory in 2022.
  2. Inflation Should Begin to Normalize
    The days of below 2% year-over-year rising in consumer prices may not return anytime soon, but runaway inflation is not our base case for 2022. The reduction in stimulative measures such as direct payments to consumers (e.g., CARES Act) and enhanced unemployment benefits from the federal government have ended. In addition, less accommodative monetary policy from the Federal Reserve and the balancing of pandemic-related supply chain issues should combine to ease the inflationary pressures felt in 2021.
  3. Improving Employment in 2022
    Total US Nonfarm payrolls reached a record in February of 2020 (just before the pandemic) of 152.5 million. Nearly two years later, that statistic is still 4 million jobs lower at 148.6 million. The unemployment rate reached a 50-year low in February 2020 of 3.5%, and we are not far from there again today at 4.2%.
    However, this number can be deceptive as it only measures those actively involved in the labor force and without a job. In other words, those who are retired or have given up searching for work are not counted in the unemployment rate that is most often cited in the news. The labor force participation rate (the sum of total number of employed persons and unemployed persons looking for work in the United States as a percentage of the working age population) remains only 61.8%, which is still 2.6% below the near-term high set in January 2020 of 63.4%, representing millions of people who have left the labor force since the pandemic began. Stable economic growth, rising wages, and a subsiding pandemic may pull people back into the labor force and push total payrolls and unemployment to higher levels in 2022. If this occurs, the increased supply of labor could also serve to slow rising wages.
  4. US Treasury Rates
    10 Year US Treasury Notes are yielding 1.6% as of the first trading day in January, after rising throughout 2021. While it is quite possible that interest rates will rise somewhat in 2022, it is important to remember that the global structural demand for fixed income by large entities like pensions, insurance companies, and sovereign wealth funds will continue to put downward pressure on interest rates. US Treasuries also carry a higher yield than the government bonds of foreign developed nations like Germany whose 10-year bunds yield 1.7% less.
  5. Headwinds Persist for Emerging Markets
    Despite looking very cheap relative to US companies, emerging market stocks as an asset class still face some potential headwinds as we enter 2022. Significant political and economic risk in China and Russia, lingering pandemic effects, lower oil prices, and a rising US Dollar are among our concerns. We continue to advocate for active management in this asset class, as we believe that there will be pockets of opportunity for skilled managers with deep research capabilities in this space.

What will ultimately impact these areas cannot be known today, but our current “known” risks that are most significant are inflation and geopolitical risks. With respect to inflation, our concern is not runaway inflation like that experienced in the US during the 1970s (conditions are much different today, as described in previous versions of this letter), but rather that higher prices could lead to declining standards of living and a pullback in consumer spending to preserve income and wealth.

On the geopolitical front, the combination of Russia and China taking aggressive military posturing toward their respective neighbors, Ukraine and Taiwan, are of significant concern for global political stability in 2022. Russia proved capable of similar aggression on a smaller scale 7 years ago in Crimea, and China’s rhetoric regarding its rights to Taiwan have become increasingly emboldened at the same time that the nation seems less concerned about blowback from western democracies like the US.

The balance of this letter is in the “usual” format with our risk-taking score and supporting charts on the beginning on the subsequent page. We thank you for reading and we look forward to a bright 2022.

Overall Risk-Taking Score

Gauge meter
  • The overall environment for accepting investment risk is slightly neutral.
  • US Economic recovery solidly on track, and the robust nature of the recovery has led to higher prices as well as challenges supplying finished goods fast enough to meet demand.
  • Risk assets, such as equity and credit globally, are trading above long-term levels on average. But corporate earnings have consistently beat expectations in 2021, which has helped to justify valuations.
  • Technical trends remain supportive as money continues to flow into risk assets.

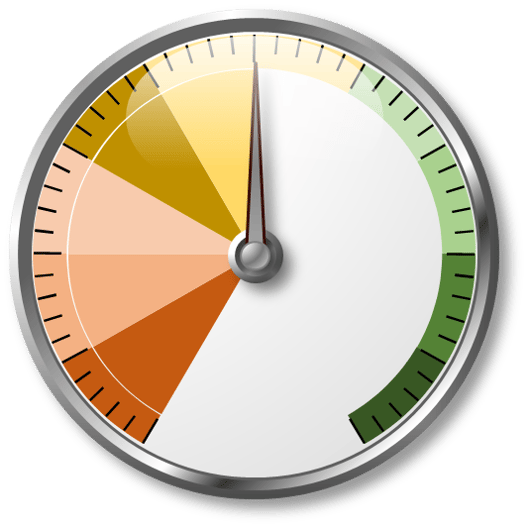
The Risk-Taking Score (RTS) should be utilized relative to your long-term strategic asset allocation selected by you and your financial advisor. The RTS is meant to be illustrative of our Investment Committee’s view toward the overall investing environment in the short-to-intermediate term (0-3 years) and how your portfolio should be positioned accordingly relative to your long-term strategic allocation.

Implications for Portfolio Management

Line graph depicting the 7-day moving average of confirmed cases in blue and fatalities in gray in the U.S. from February 2020 to October 2021
Source: Centers for Disease Control and Prevention, Johns Hopkins CSSE, Our World in Data, J.P. Morgan Asset Management as of December 31, 2021.

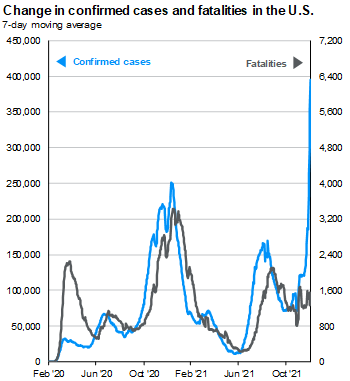
The supporting sections below paint a picture for investing in 2022 that feels very similar to investing in 2021: Economic stability and growth juxtaposed against above-average asset class valuations. Populations in many developed nations began receiving their first dose of COVID-19 vaccinations in early 2021, and now many are receiving their third (booster) dose during a wave of the Omicron variant that appears to be highly transmissible yet less deadly for those who have been vaccinated. Nevertheless, the most recent flare-up in cases seems to be dragging on consumer activity, particularly in the hospitality and travel industries. The key difference at the beginning of 2022 vs. the start to 2021 may be that stimulus and accommodative policies from the US federal government and Federal Reserve are ebbing rather than flowing as these entities seek to pare back pandemic era economic support.

We sincerely believe that 2022 will favor thoughtful asset allocation and stock selection rather than the S&P 500 leading the way yet again. Below are key themes and considerations that we advocate for investors going into 2022. Many of these are holdovers from 2021, and may be even more important in the year ahead:

  1. High quality fixed income will continue to provide lackluster returns, but there is little substitute for liquidity during times of stress. Consider a combination of short maturity high-quality bonds, inflation-protected bonds, and low volatility alternative strategies in place of the traditional fixed income portfolio.
  2. Continue to diversify equity portfolios away from US large growth companies in favor of less expensive, higher yielding equities which should provide participation in broad market rallies, defense in market declines, and current income in sideways markets.
  3. Foreign equities, particularly in developed markets deserve more investor attention. For a variety of reasons, these stocks as a group have underperformed US equities for more than a decade, but investors should consider maintaining or adding exposure today, preferably through actively managed strategies rather than through passive exchange-traded funds, particularly in emerging markets.
  4. Increase exposure to alternative investing strategies such as hedge funds and absolute return strategies that may provide lower volatility than equities with the potential for returns not highly correlated with either traditional stock or bond markets.

Line graph depicting Median S&P 500 P/Es as well as Valuation Spread, both for their 25-year average and their Current, from 1997 to 2021, with text reading: The median price-to-earnings ratio within the S&P 500 is 20x today, implying on the surface that the index is “expensive” relative to its history. However, a look beneath the surface shows a historically wide spread between the valuation of the 80th and 20th percentiles of company P/E ratios within the index (grey bands). In other words, the index-level data doesn’t paint an accurate picture of the opportunities within it.

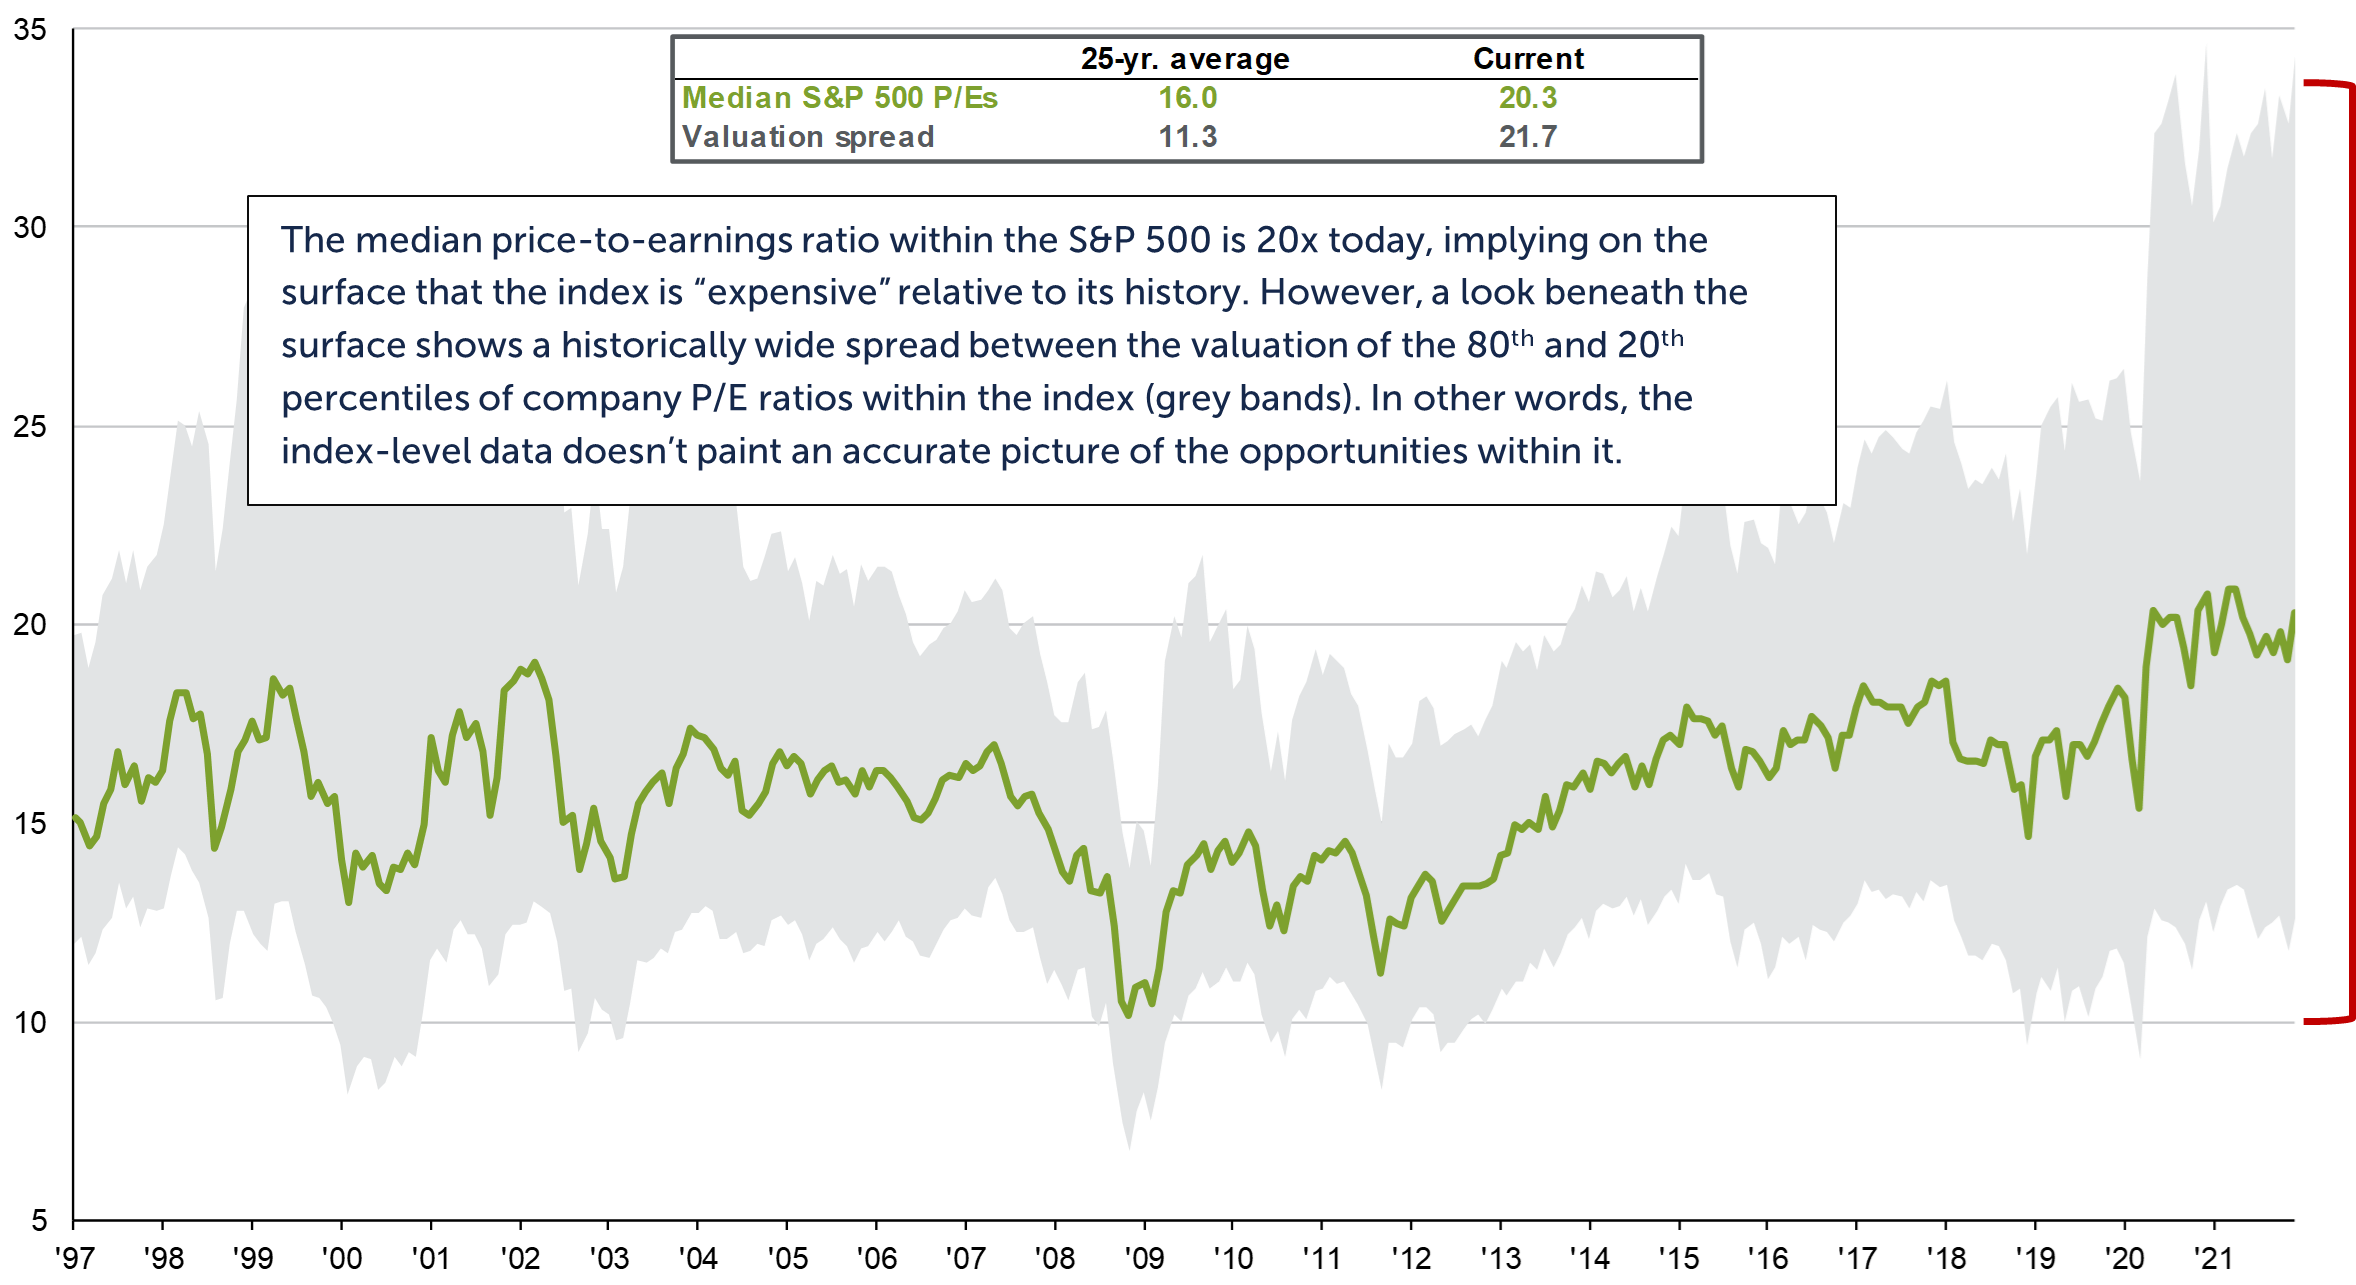
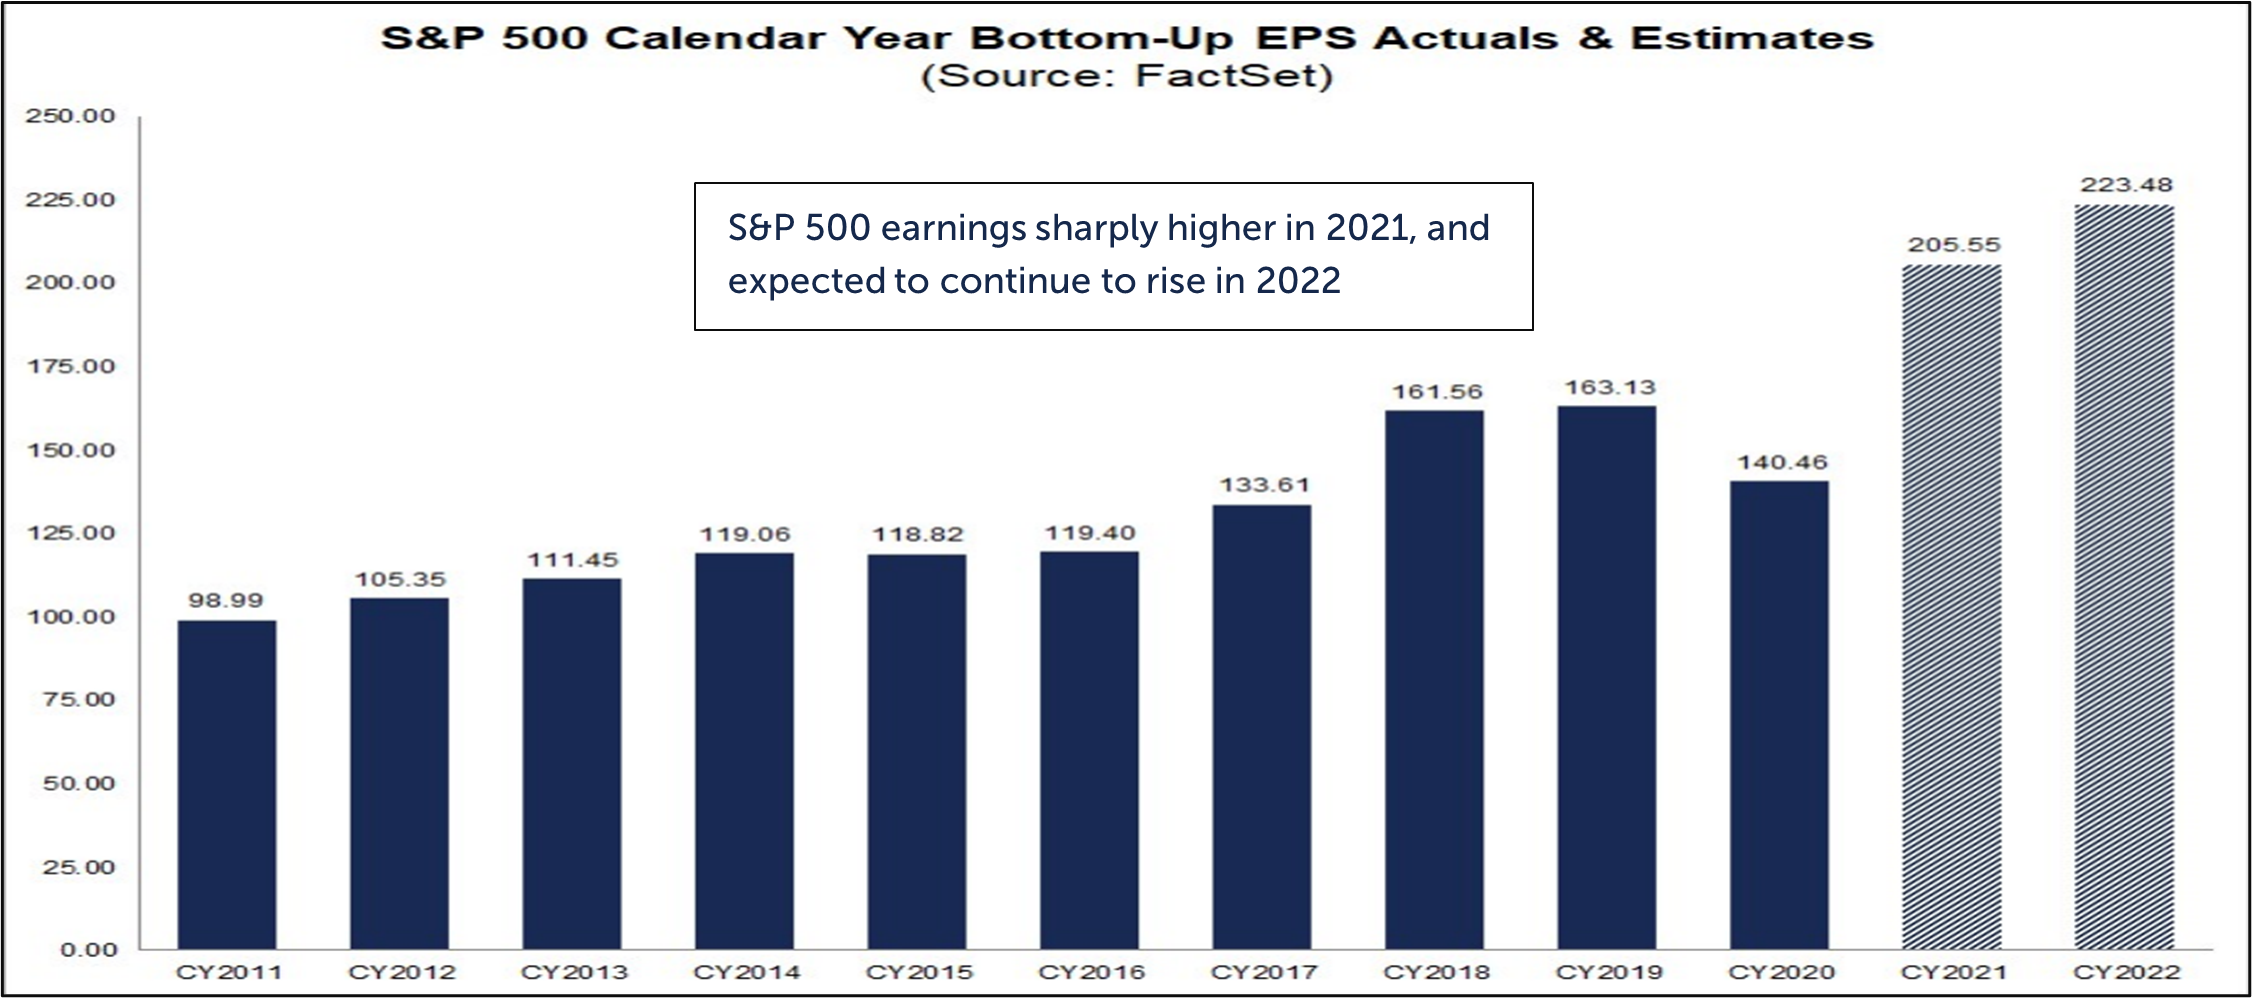
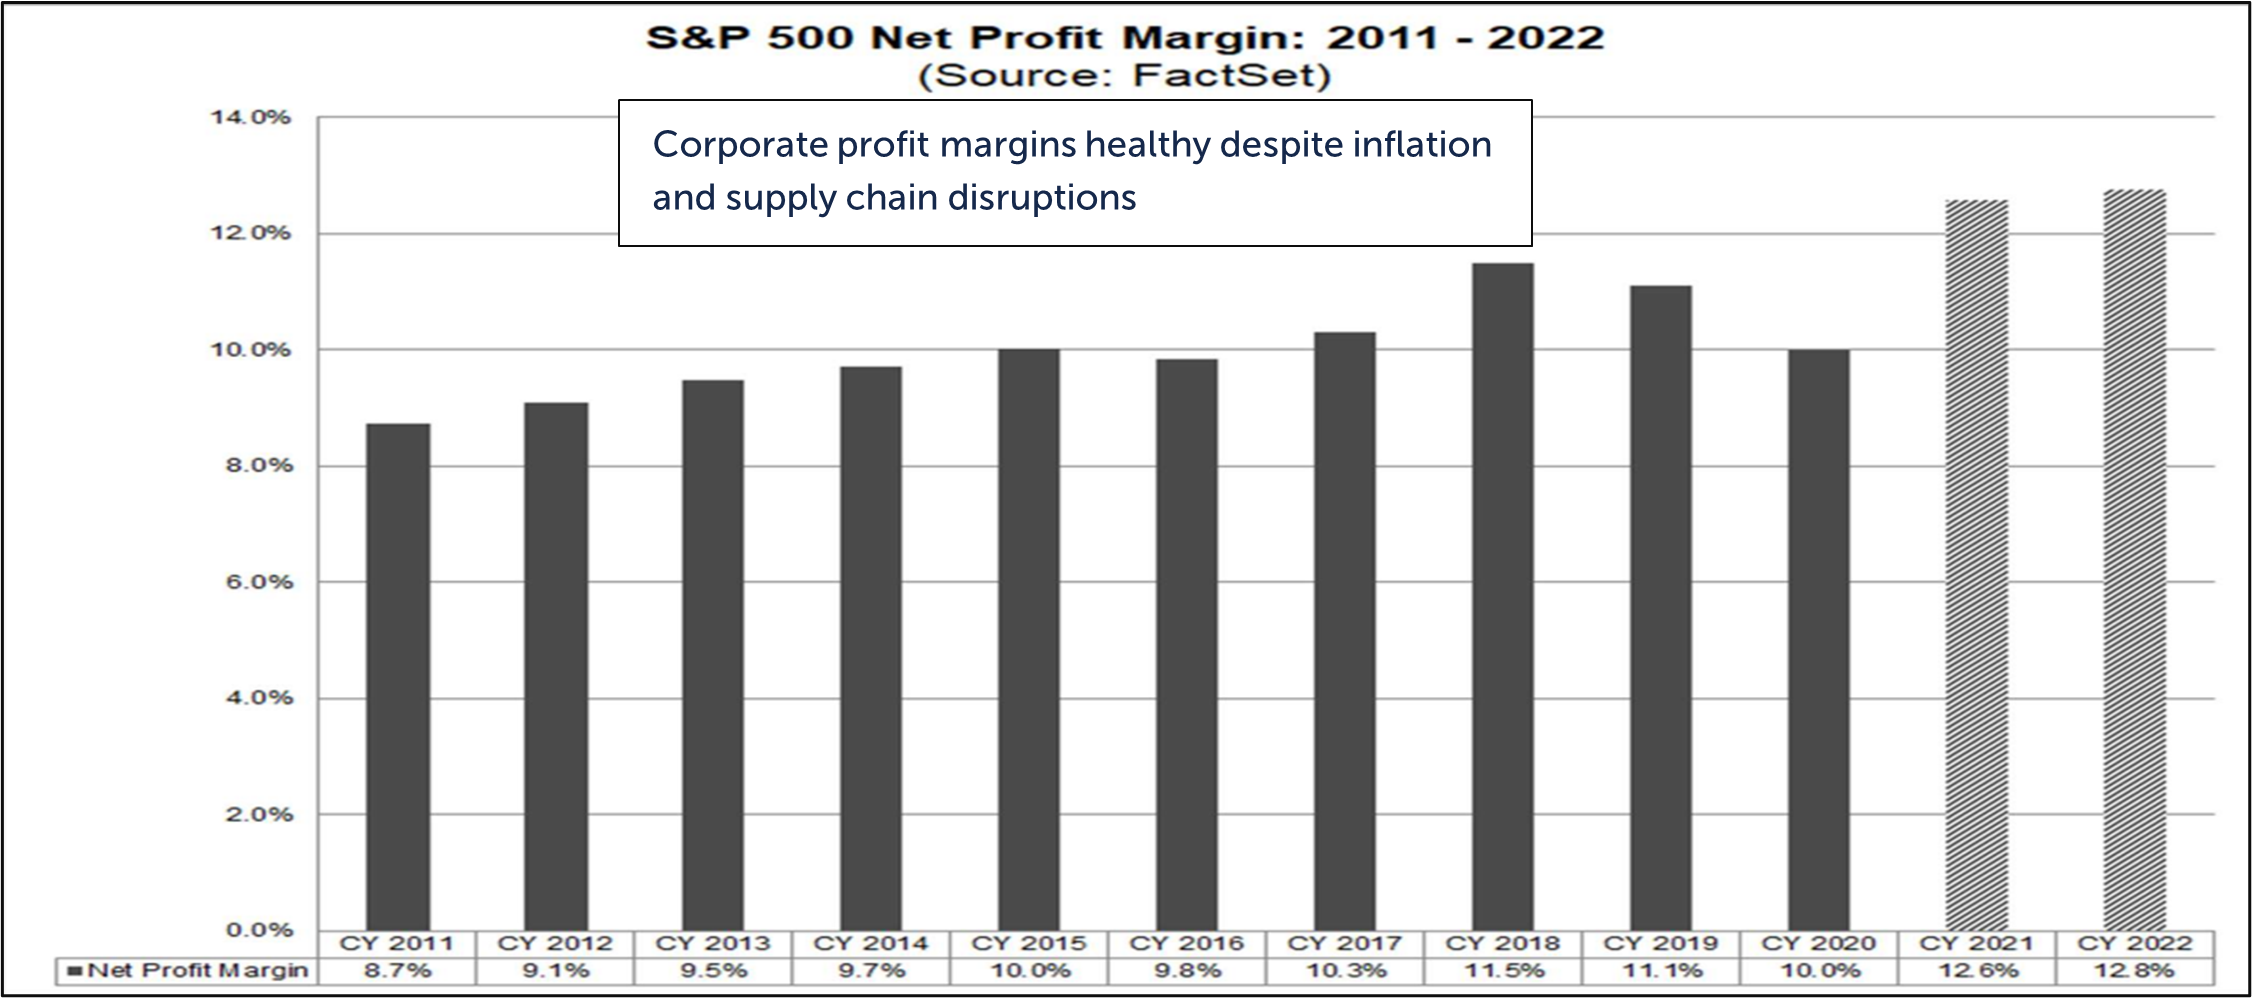
Source: Compustat, FactSet, Standard & Poor’s, J.P. Morgan Asset Management as of December 31, 2021.

Economy

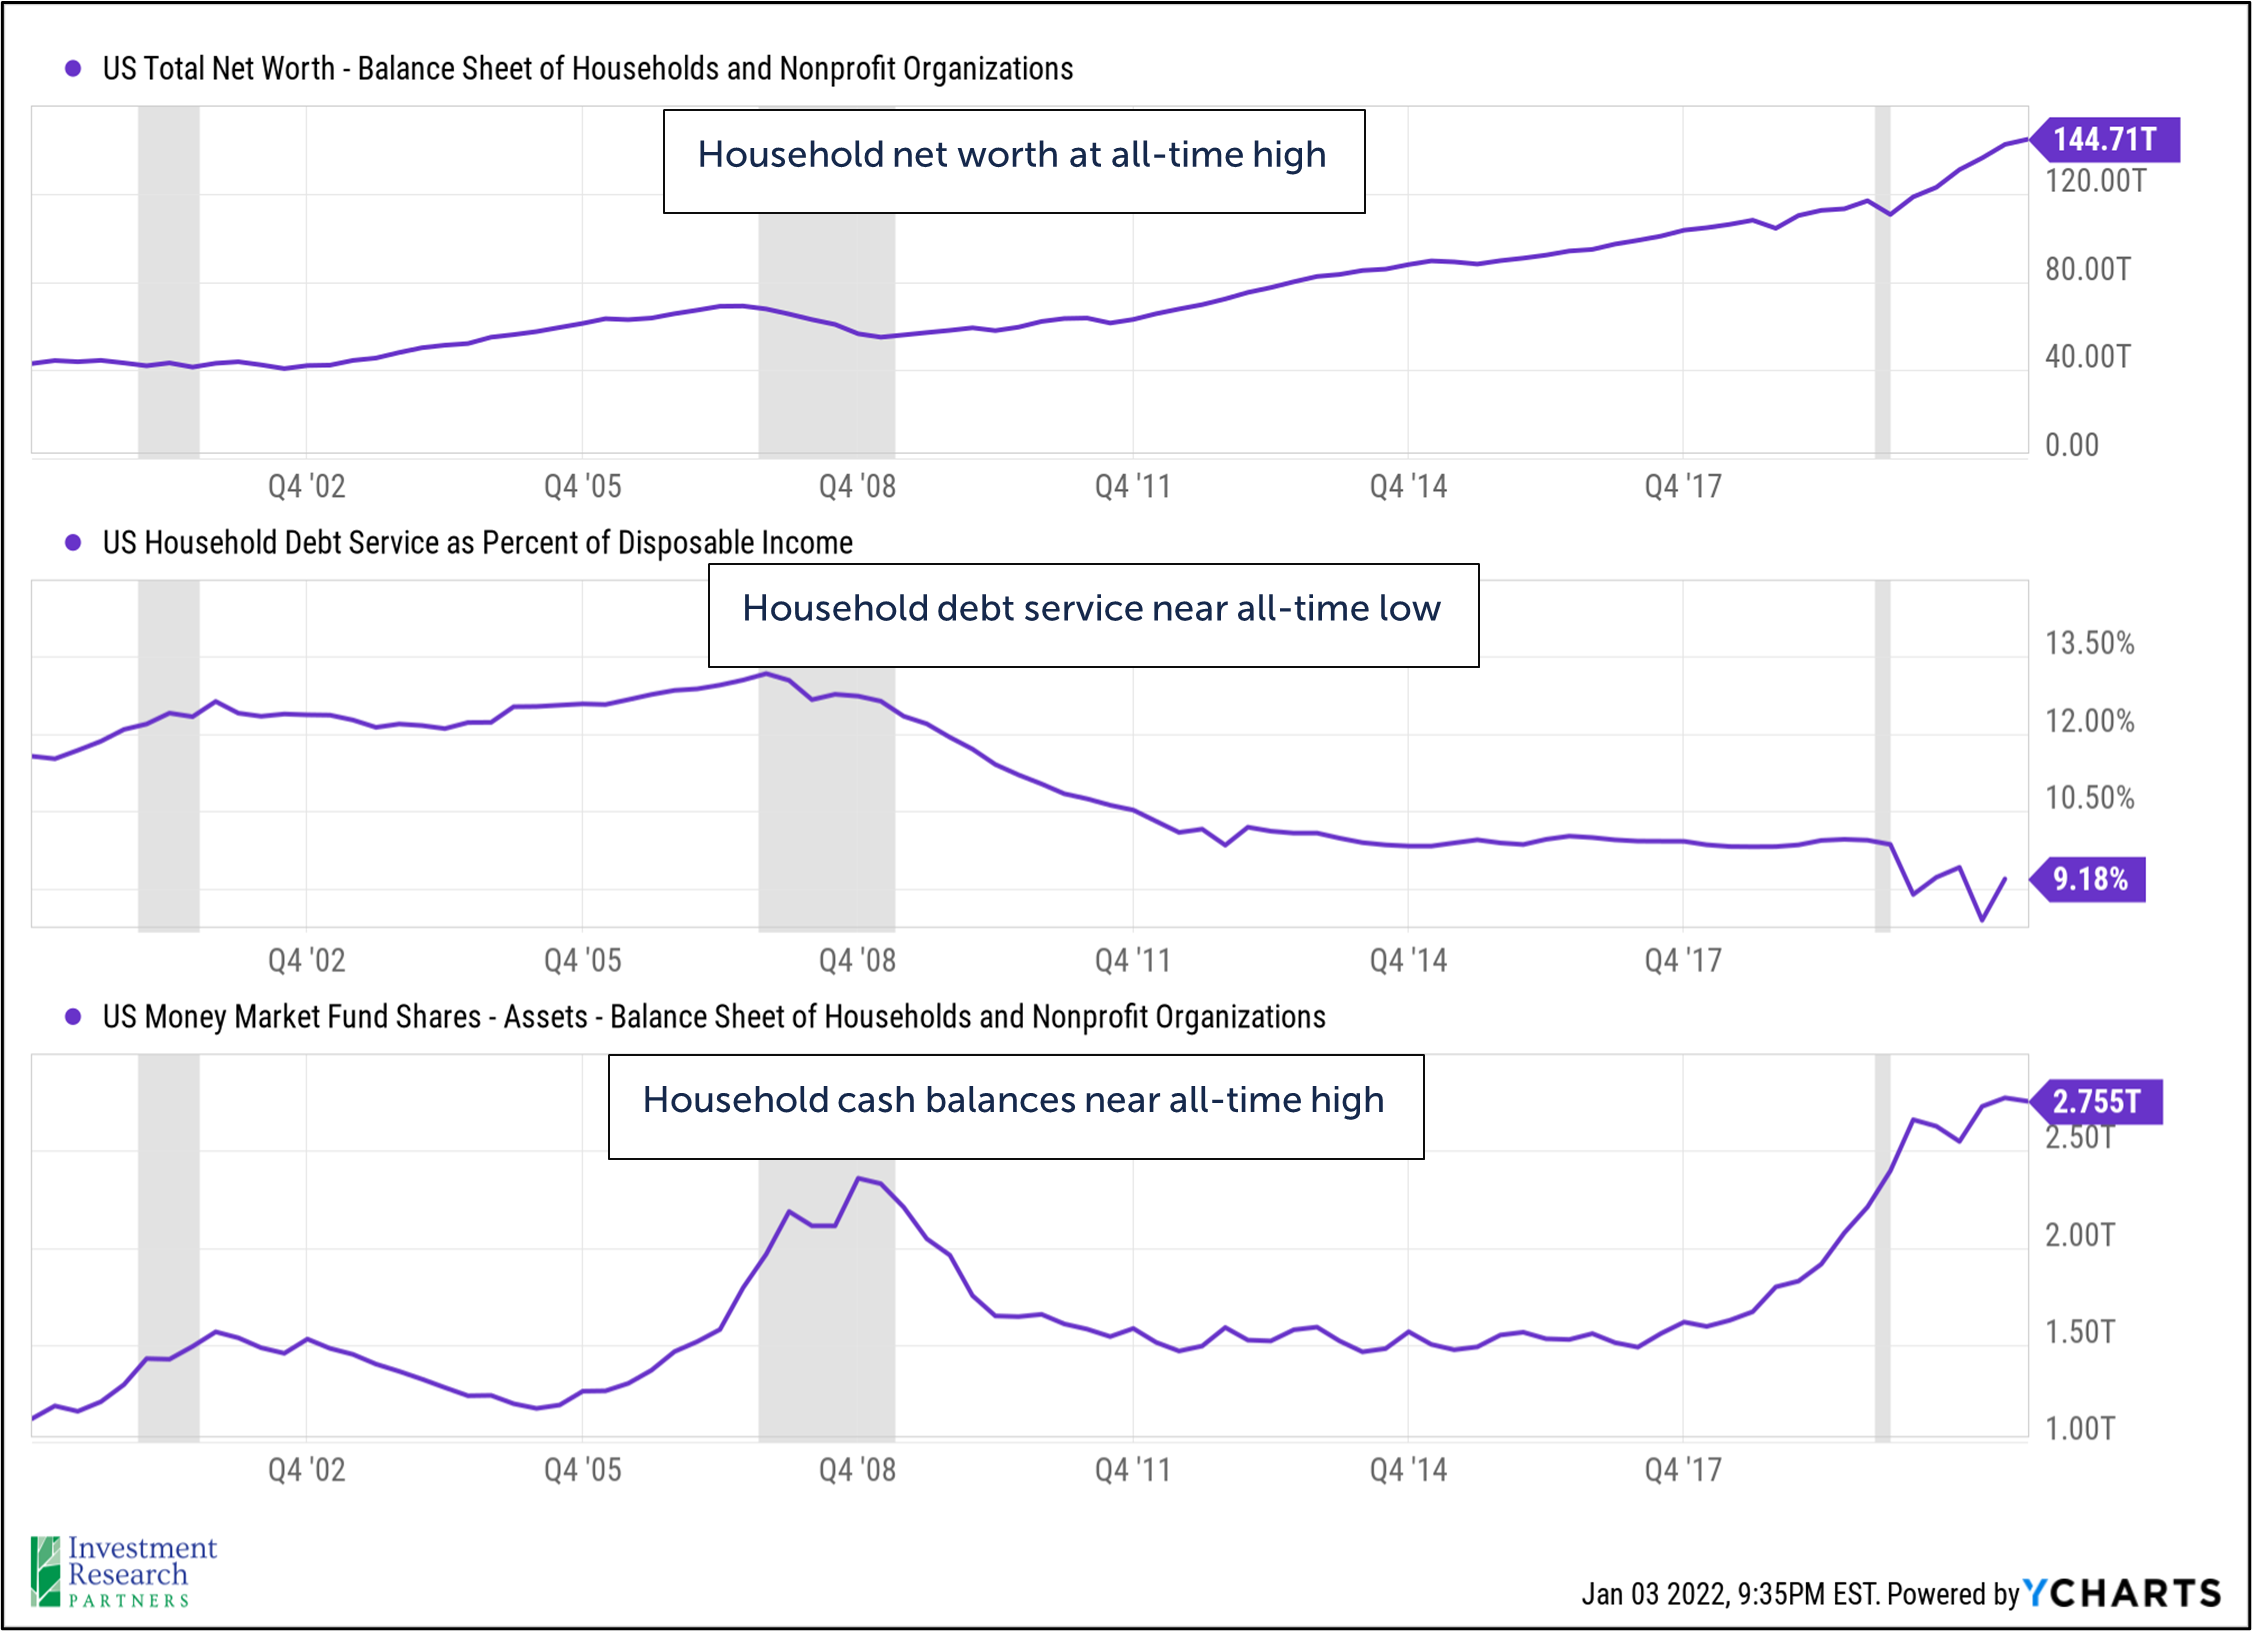
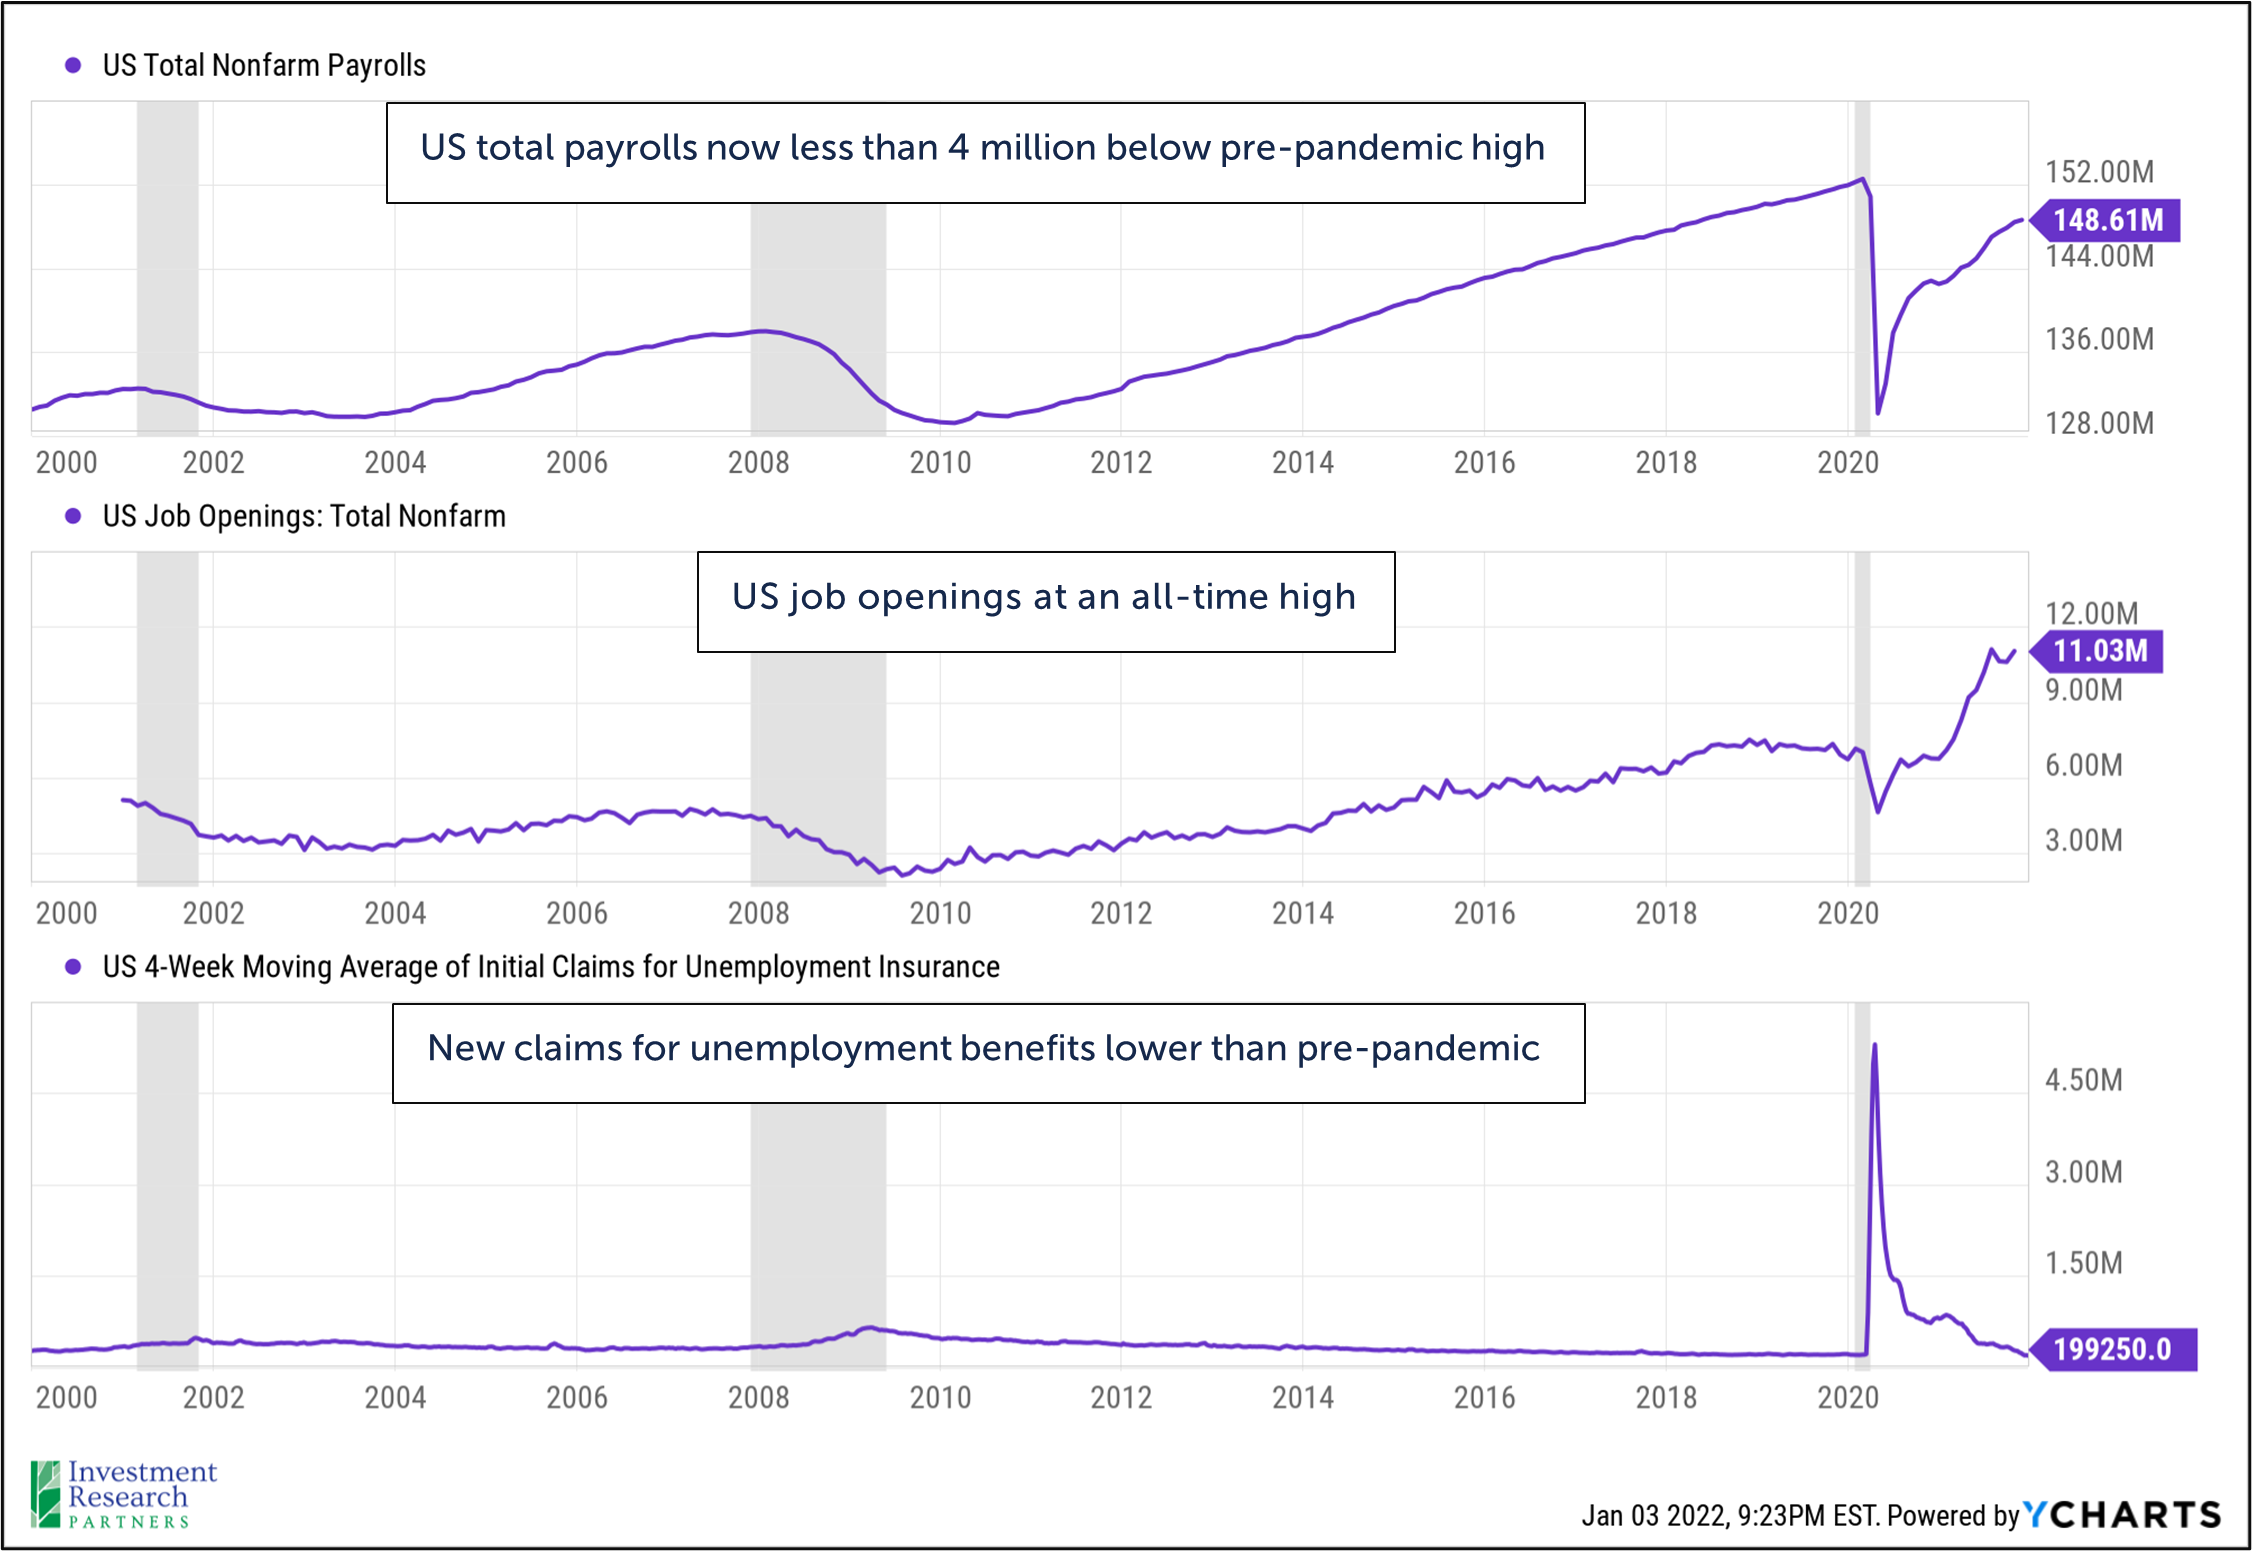
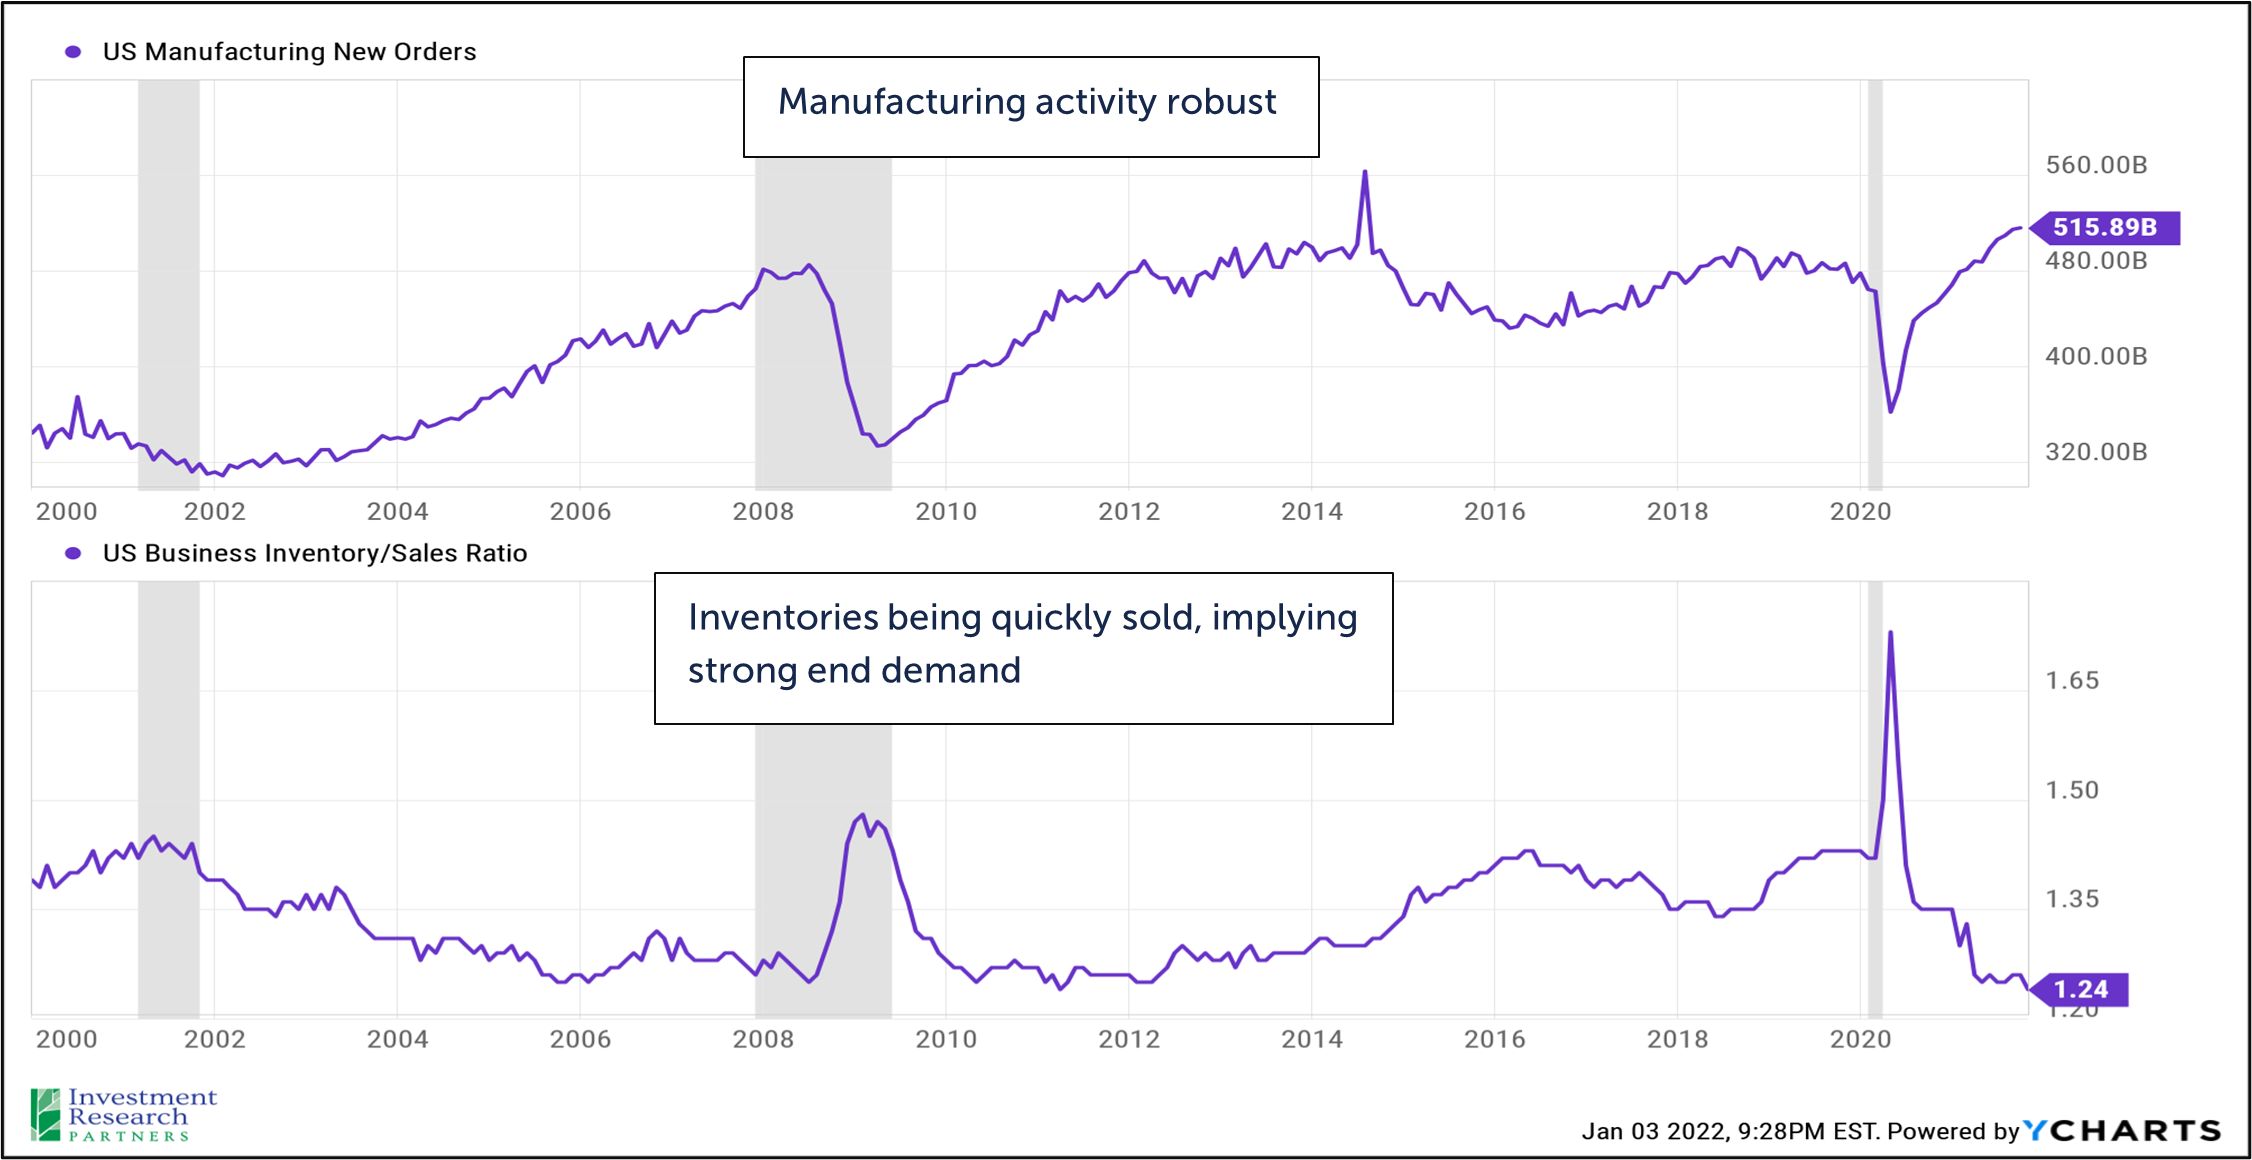
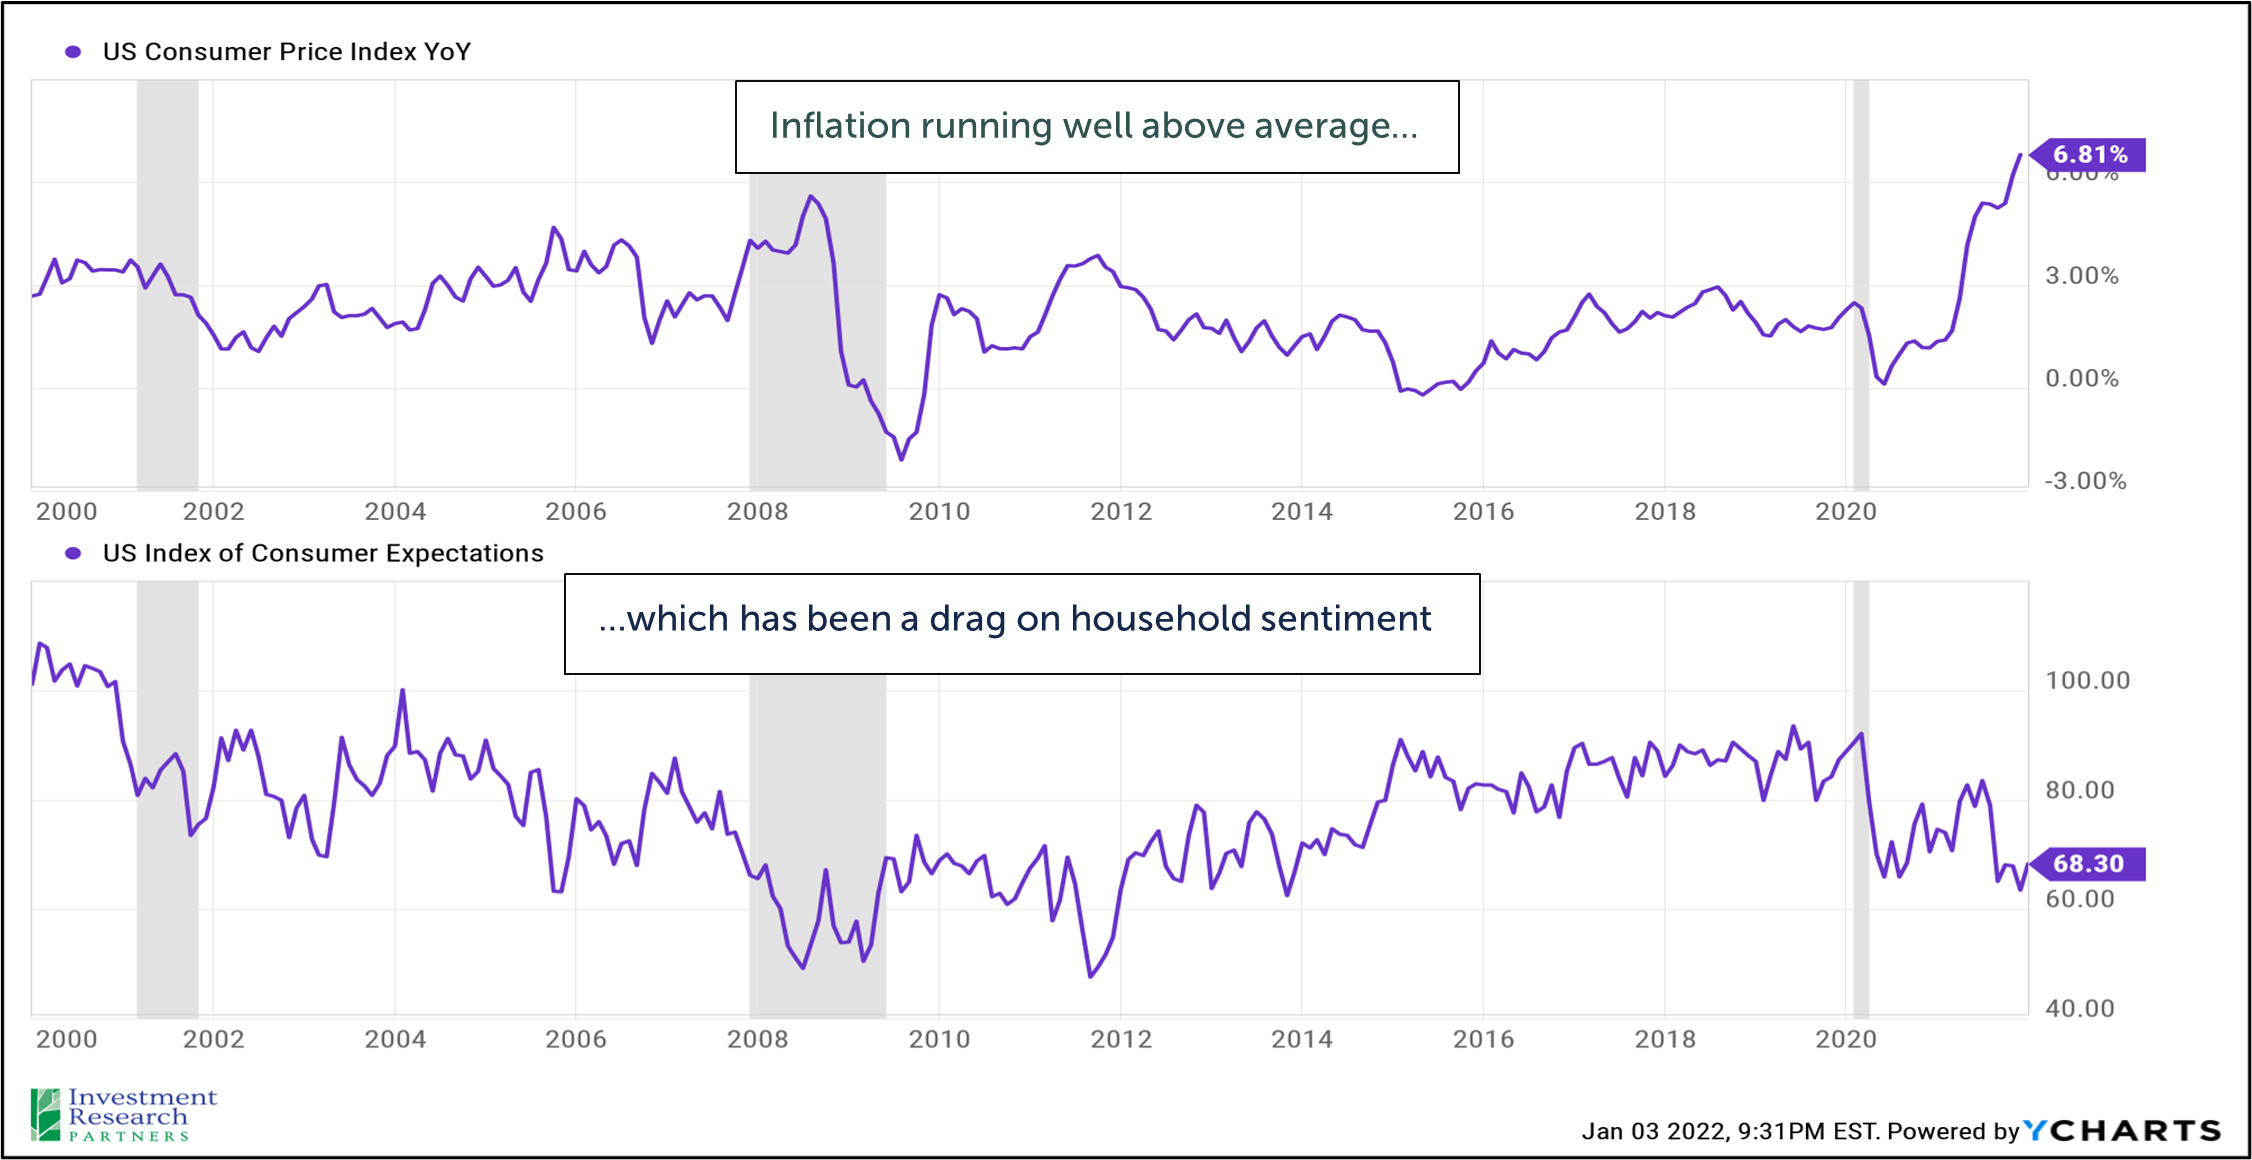
US economic growth remains in an upward trajectory. Inflation and supply chain-related issues continue to receive media attention, but these issues are largely driven by very robust demand for goods and services. Much of this demand is being driven by households which, on average, are in the best financial position in decades as a result of fiscal stimulus and low interest rates. Labor markets have been improving rapidly, with the unemployment rate dropping rapidly to 4.2%, just 0.7% above the 50-year lows set in early 2020. US manufacturing new orders are robust, and we have not yet seen evidence of a concerning build-up in inventories that has predicated past recessions. However, the sharp rise in inflation which began in summer 2021 coincided with a swift reversal of household sentiment as those surveyed responded with concerns that higher prices would erode their standard of living. It will be important to monitor inflation and household sentiment throughout 2022 in order to determine if supply and demand can find a balance without causing American households to simultaneously and meaningfully reduce their spending.

A line graph depicting US Total Net Worth - Balance Sheet of Households and Nonprofit Organizations from Q4 2002 to Q4 2017 with text reading: Household net worth at all-time high, a line graph depicting US Household Debt Service as Percent of Disposable Income rom Q4 2002 to Q4 2017 with text reading: Household debt service near all-time low, and a line graph depicting US Money Market Fund Shares - Assets - Balance Sheet of Households and Nonprofit Organizations from Q4 2002 to Q4 2017 with text reading: Household cash balances near all-time high

A line graph depicting US Total Nonfarm Payrolls from 2000 to 2021 with text reading: US total payrolls now less than 4 million below pre-pandemic high, a line graph depicting US Job Openings: Total Nonfarm form 2000 to 2021 with text reading: US job openings at an all-time high, and a line graph depicting US 4-Week Moving Average of Initial Claims for Unemployment Insurance from 2000 to 2021 with text reading: New claims for unemployment benefits lower than pre-pandemic

A line graph depicting US Manufacturing New Orders from 2000 to 2021 with text reading: Manufacturing activity robust, and a line graph depicting US Business Inventory/Sales Ratio from 2000 to 2021 with text reading: Inventories being quickly sold, implying strong end demand

A line graph depicting US Consumer Price Index YoY from 2000 to 2021 with text reading: Inflation running well above average..., and a line graph depicting US Index of Consumer Expectations from 2000 to 2021 with text reading: ...which has been a drag on household sentiment

Corporate Earnings

2021 was a robust year for corporate earnings growth. S&P 500 companies consistently outperformed analysts’ expectations all year, and future expectations for 2022 continued to be revised higher. At the start of the year, the index was barely expected to reach 2019 levels, the last full calendar year before the pandemic. However, S&P 500 earnings are expected to end the year more than 25% higher than 2019, and 2022 is expected to advance another 9%. Net profit margin, the amount investors earn after all business costs, debt service and taxes, also outperformed expectations in 2021. Along with earnings growth in 2022, it will be important for investors to monitor trends in company profitability to determine if they are able to manage higher costs for materials and labor.

Bar graph depicting S&P 500 Calendar Year Bottom-Up EPS Actuals & Estimates from CY2011 to CY2022 with text reading: S&P 500 earnings sharply higher in 2021, and expected to continue to rise in 2022

Bar graph depicting S&P 500 Net Profit Margin from 2011 to 2022 with text reading: Corporate profit margins healthy despite inflation and supply chain disruptions

Valuation

Line graph depicting the weight of the top 10 stocks in the S&P 50 from 1996 to December 31, 2021

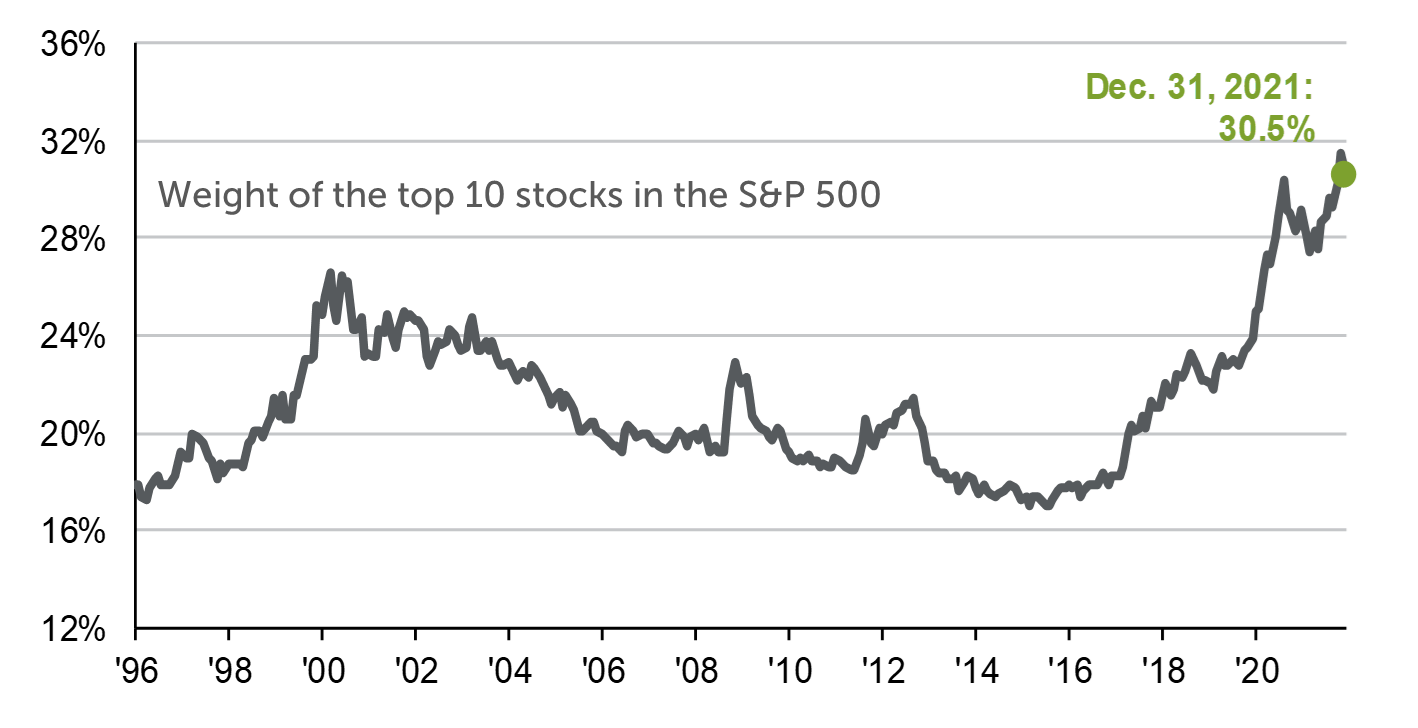
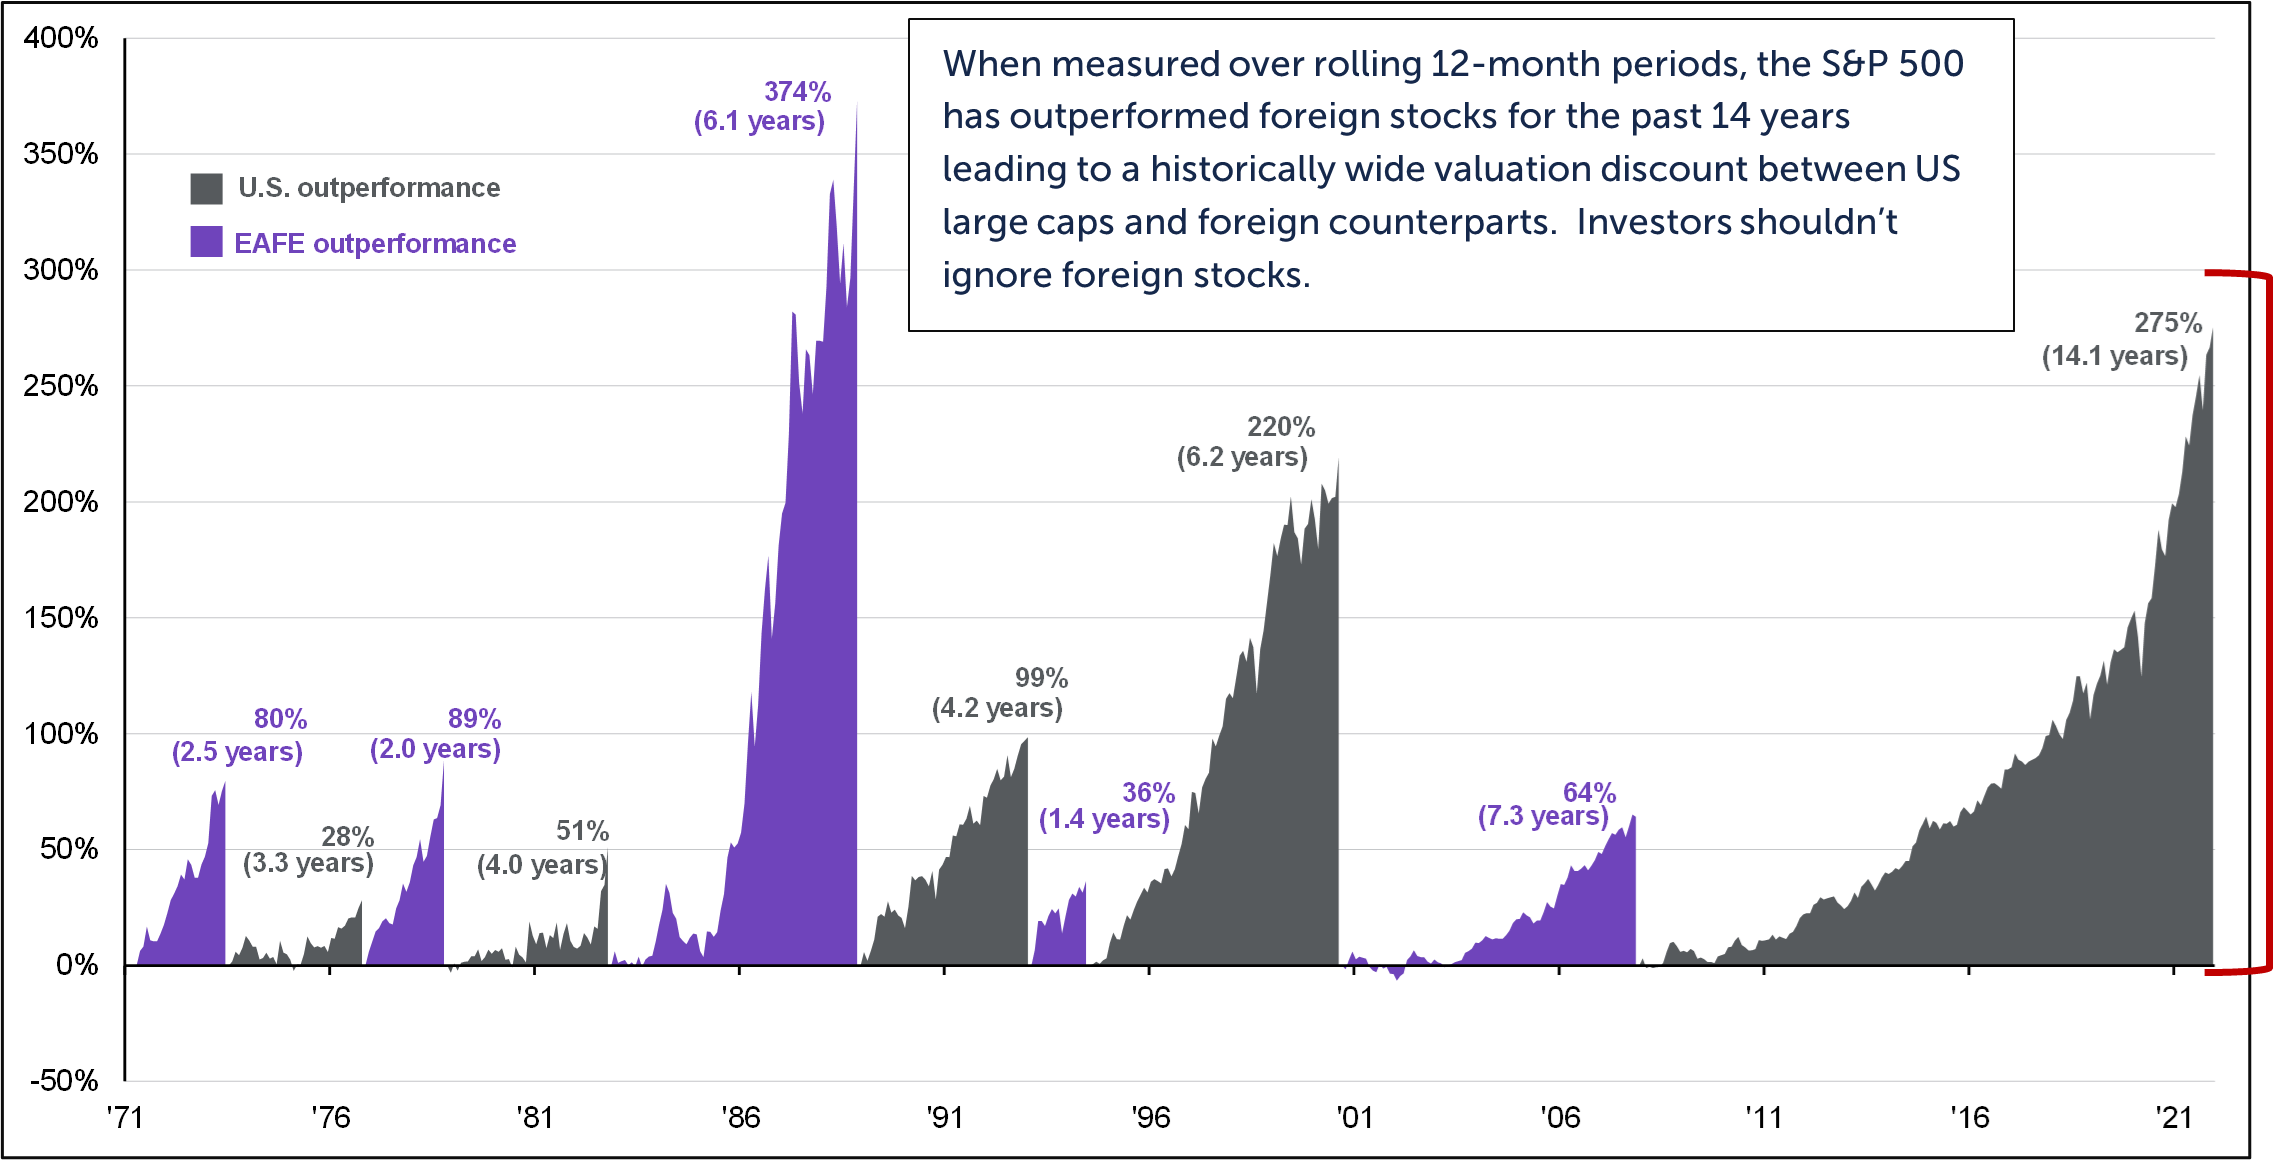
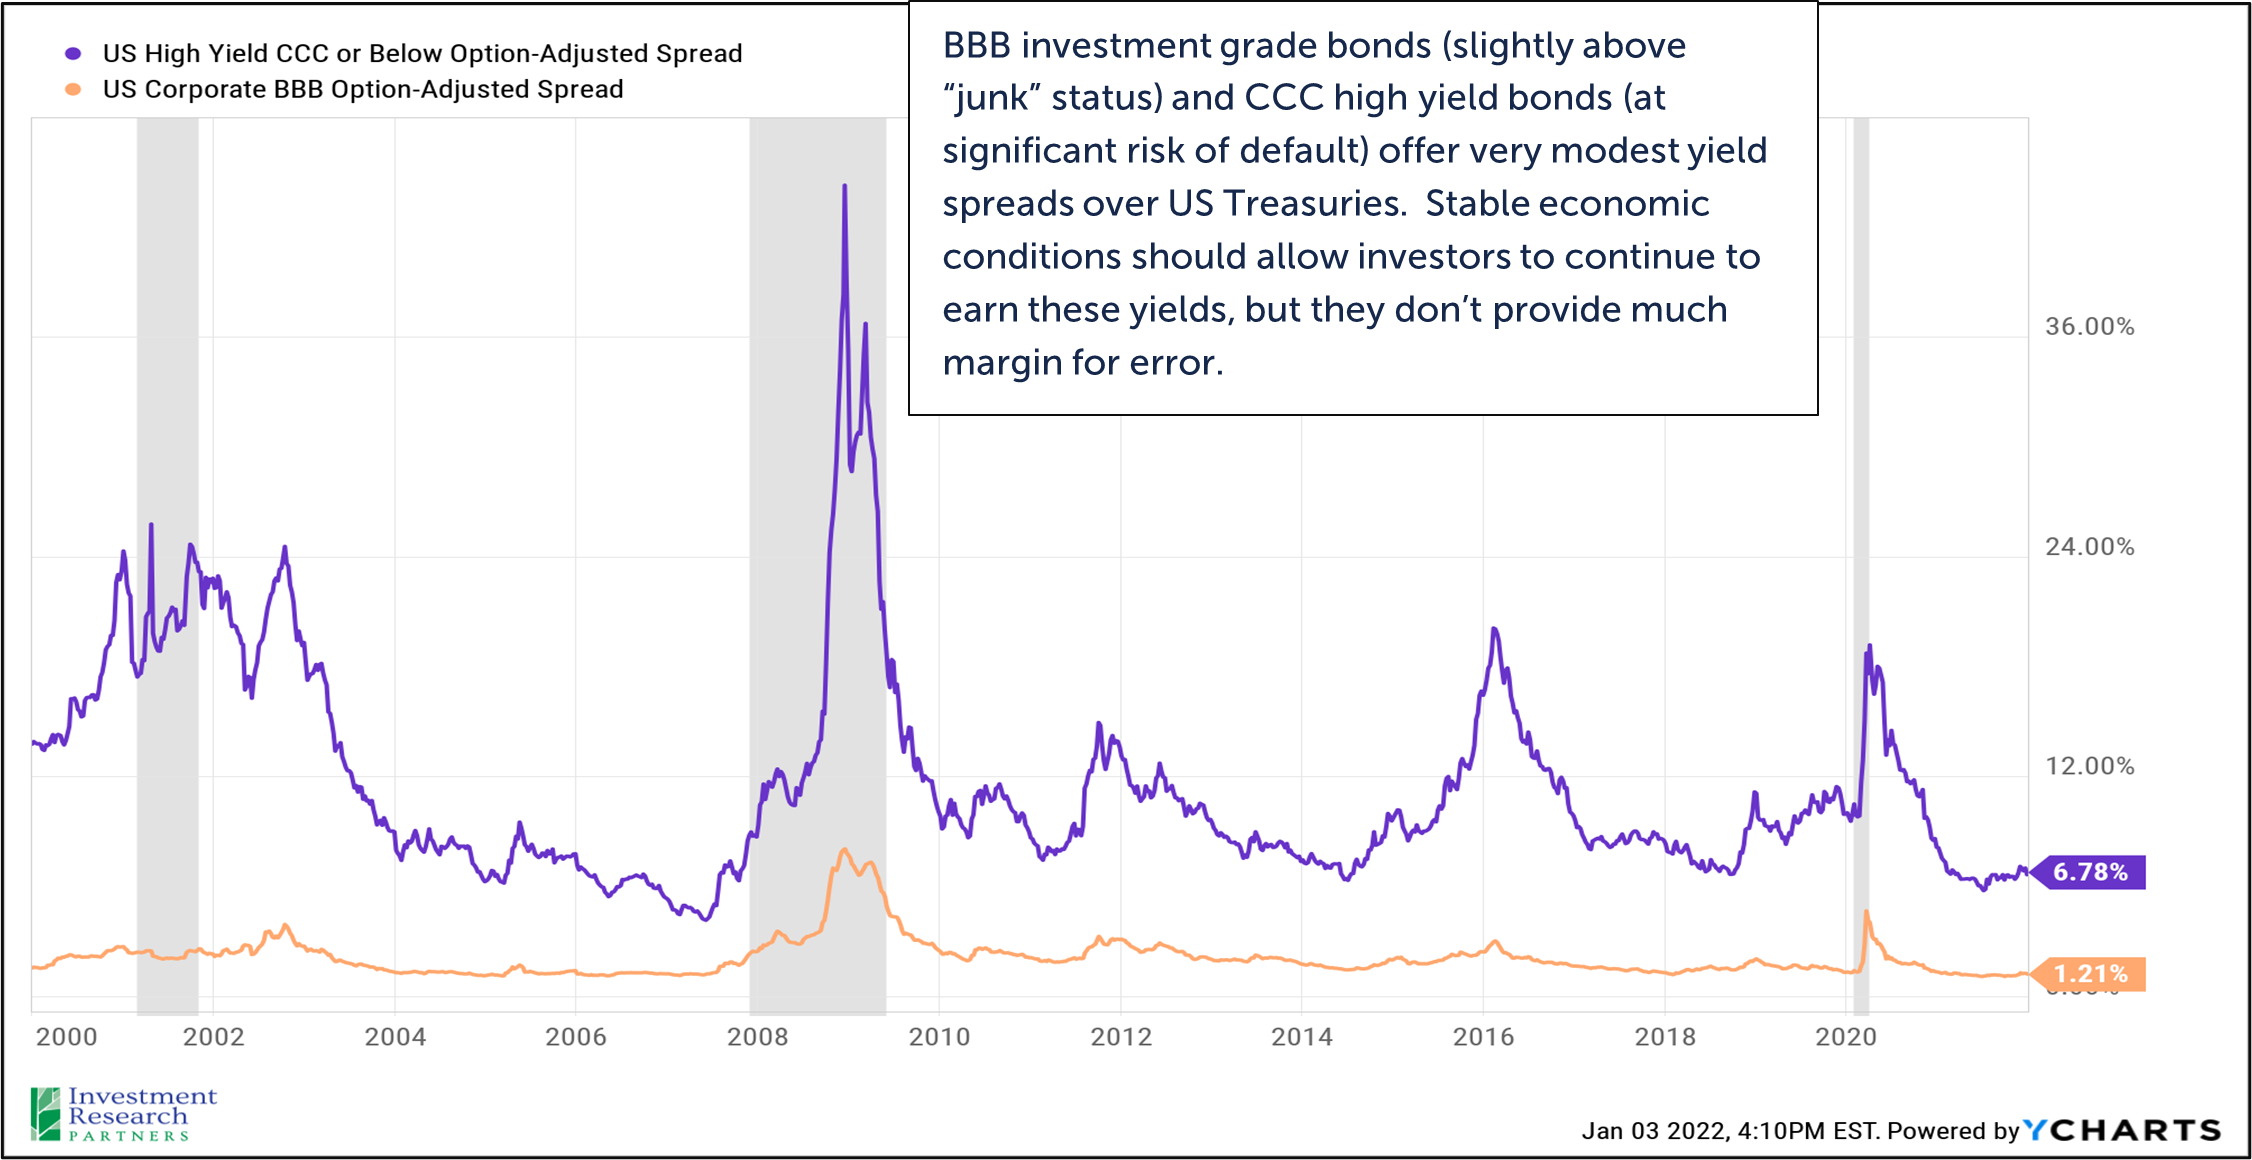
When assessing stock market valuation, investors often first look to the S&P 500 index as a gauge. When viewed on the aggregate index level, stocks do appear to be trading modestly rich relative to history. However, as highlighted by the valuation dispersion chart on page 4, the index-level data is not an accurate representation of today’s market. A historically high level of the S&P 500’s market cap is represented by just ten companies.[2] Foreign equities may offer relative value as these asset classes now trade at historically low discounts to their US counterparts. Lastly, US credit remains unattractive based on very modest yields relative to potential risks.

S&P 500 Price-to-Expected Earnings
Line graph depicting S&P 500 Price-to-Expected Earnings from 1996 to December 31, 2021

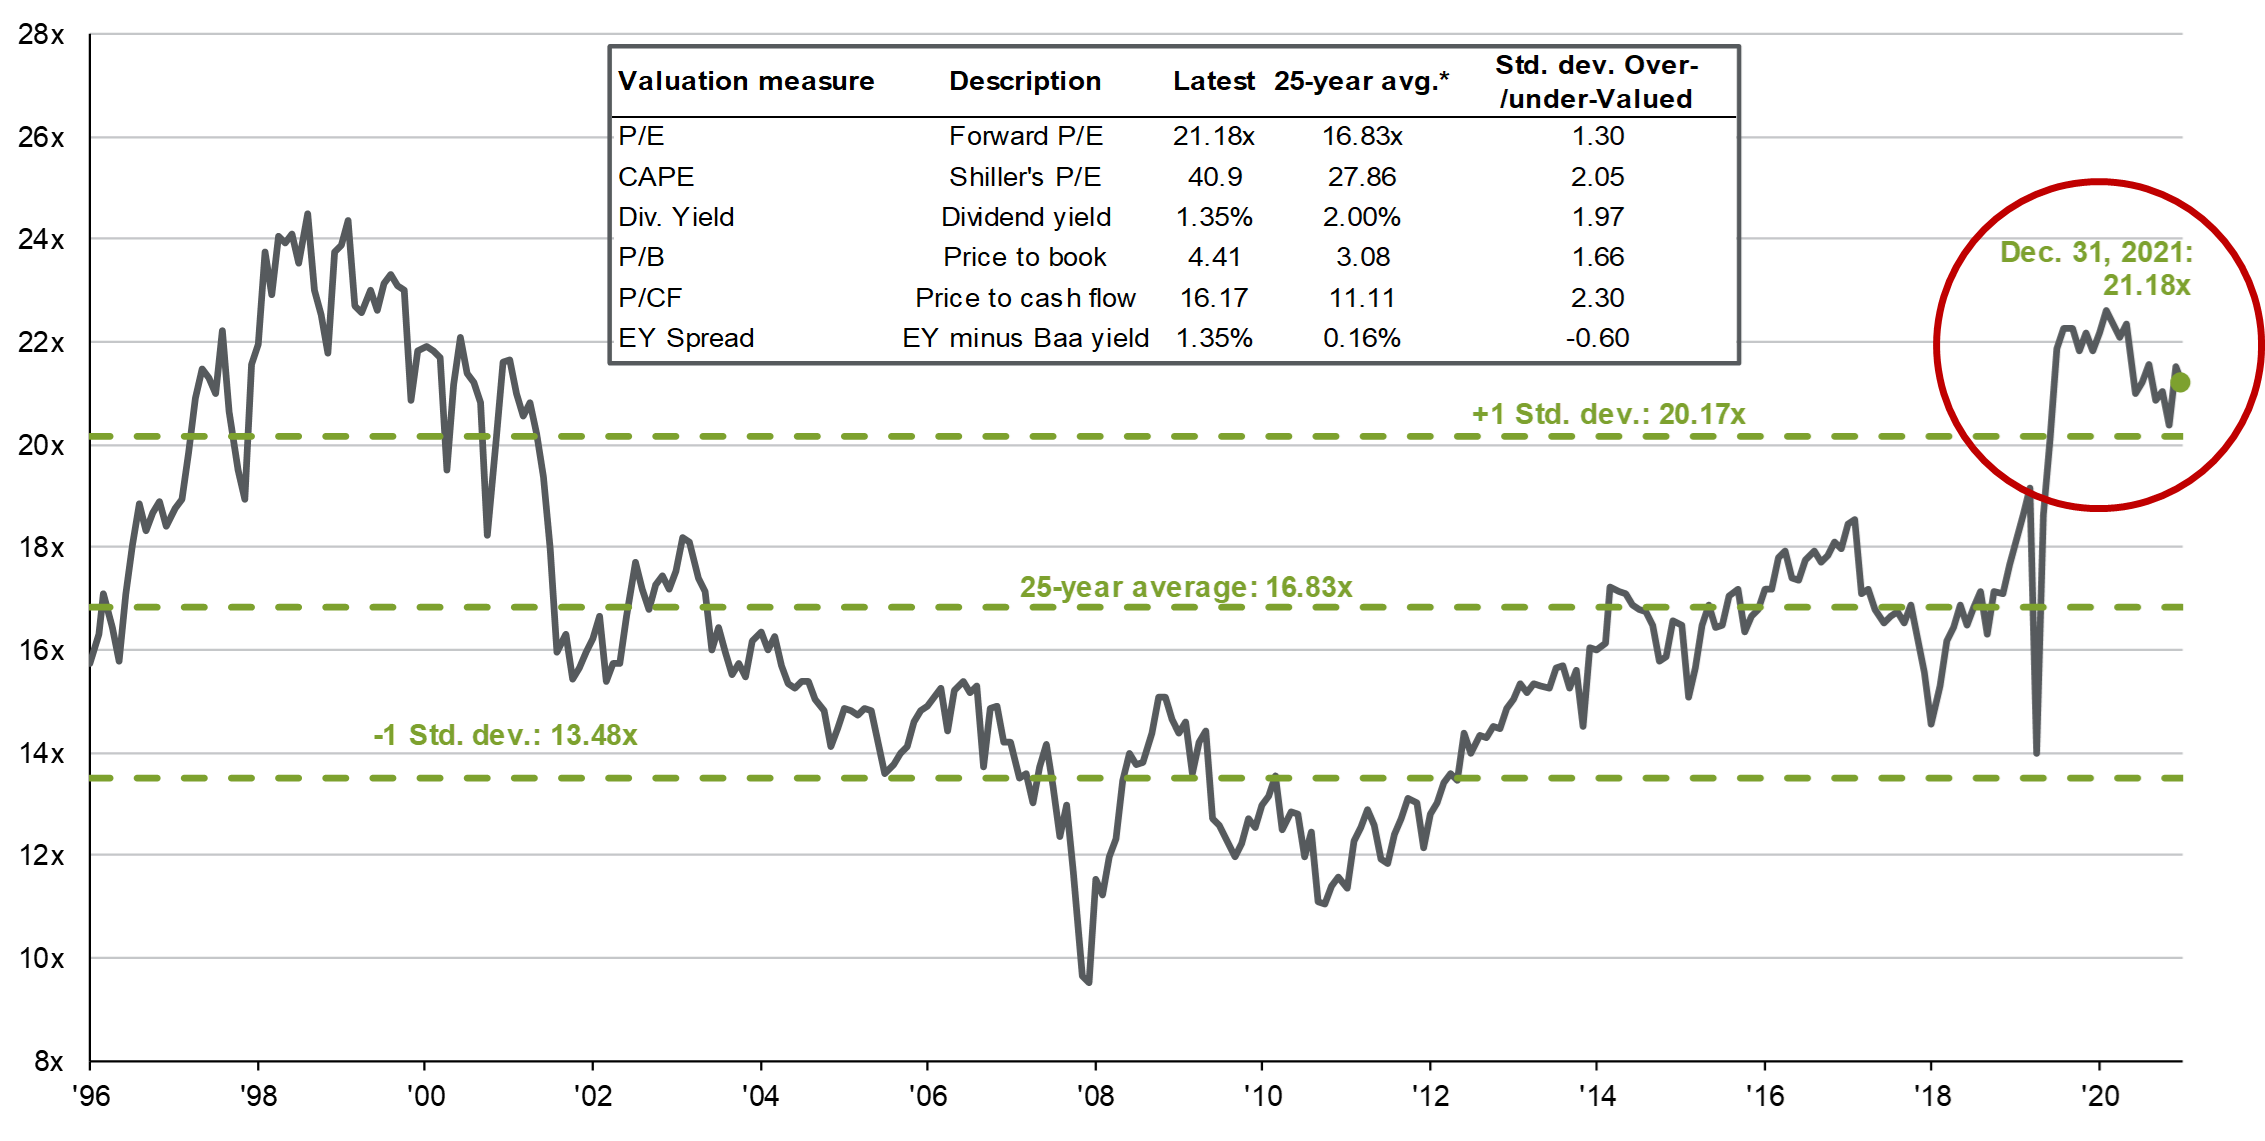
Source: FactSet, FRB, Robert Shiller, Refinitiv Datastream, Standard & Poor’s, Thomson Reuters, J.P. Morgan Asset Management as of December 31, 2021.

Chart depicting U.S. outperformance in gray and EAFE outperformance in purple from 1971 to 2021 with text reading: When measured over rolling 12-month periods, the S&P 500 has outperformed foreign stocks for the past 14 years leading to a historically wide valuation discount between US large caps and foreign counterparts. Investors shouldn’t ignore foreign stocks.

Line graph depicting US High Yield CCC or Below Optoin-Adjusted Spread and US Corporate BBB Option-Adjusted Spread from 2000 to 2021 with text reading: BBB investment grade bonds (slightly above “junk” status) and CCC high yield bonds (at significant risk of default) offer very modest yield spreads over US Treasuries. Stable economic conditions should allow investors to continue to earn these yields, but they don’t provide much margin for error.


Prices & Interest Rates

Representative Index Current Year-End 2020
Crude Oil (US WTI) $75.37 $48.52
Gold $1,828 $1,893
US Dollar 95.67 89.94
2 Year Treasury 0.73% 0.13%
10 Year Treasury 1.52% 0.93%
30 Year Treasury 1.93% 1.65%
Source: Morningstar, YCharts, and US Treasury as of December 31, 2021


Asset Class Returns

Category Representative Index Full Year 2021 Full Year 2020
Global Equity MSCI All-Country World 18.5% 16.3%
Global Equity MSCI All-Country World ESG Leaders 20.8% 16.0%
US Large Cap Equity  S&P 500 28.7% 18.4%
US Large Cap Equity  Dow Jones Industrial Average 21.0% 9.7%
US Large Cap Equity  Russell 3000 Growth 25.9% 38.3%
US Large Cap Equity  Russell 3000 Value 25.4% 2.9%
US Small Cap Equity  Russell 2000 14.8% 20.0%
Foreign Developed Equity MSCI EAFE 11.3% 7.8%
Emerging Market Equity MSCI Emerging Markets -2.5% 18.3%
US Fixed Income Bloomberg Barclays Municipal Bond 1.5% 5.2%
US Fixed Income Bloomberg Barclays US Agg Bond -1.5% 7.5%
Global Fixed Income Bloomberg Barclays Global Agg. Bond -4.7% 9.2%
Source: YCharts as of December 31, 2021


[1] Source: Bloomberg
[2] Source: FactSet, Standard & Poor’s, J.P. Morgan Asset Management as of December 31, 2021


Download PDF Version


Past performance may not be representative of future results.  All investments are subject to loss.  Forecasts regarding the market or economy are subject to a wide range of possible outcomes.  The views presented in this market update may prove to be inaccurate for a variety of factors.  These views are as of the date listed above and are subject to change based on changes in fundamental economic or market-related data.  Please contact your Financial Advisor in order to complete an updated risk assessment to ensure that your investment allocation is appropriate.

Share This: