

August 5, 2021 •OneAscent

 |
|
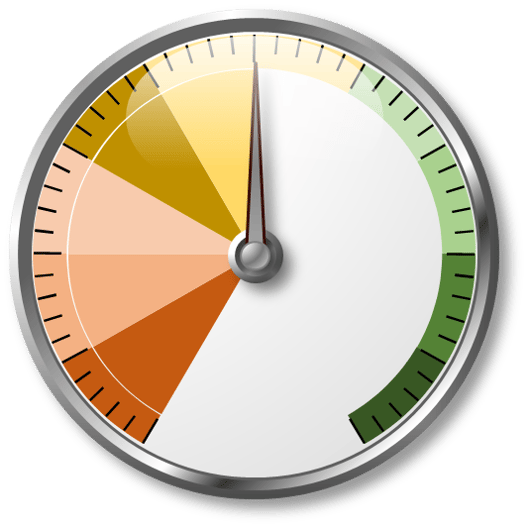
We monitor the backdrop for investing in risk assets across three primary pillars: economic conditions, asset prices, and technical considerations such as investor sentiment and price momentum. Since last month, our assessment of the environment for accepting investment did not change. The economy remains healthy on average; households are in good financial shape, seeing wage gains, and spending. The labor market is improving, and financial conditions are quite accommodative. Risk asset classes such as equities and credit are trading above long-term averages, which is the primary factor holding back the overall risk-taking score. The potential for an extended period of above-average inflation also gives us pause. Given current conditions, we advocate investors:
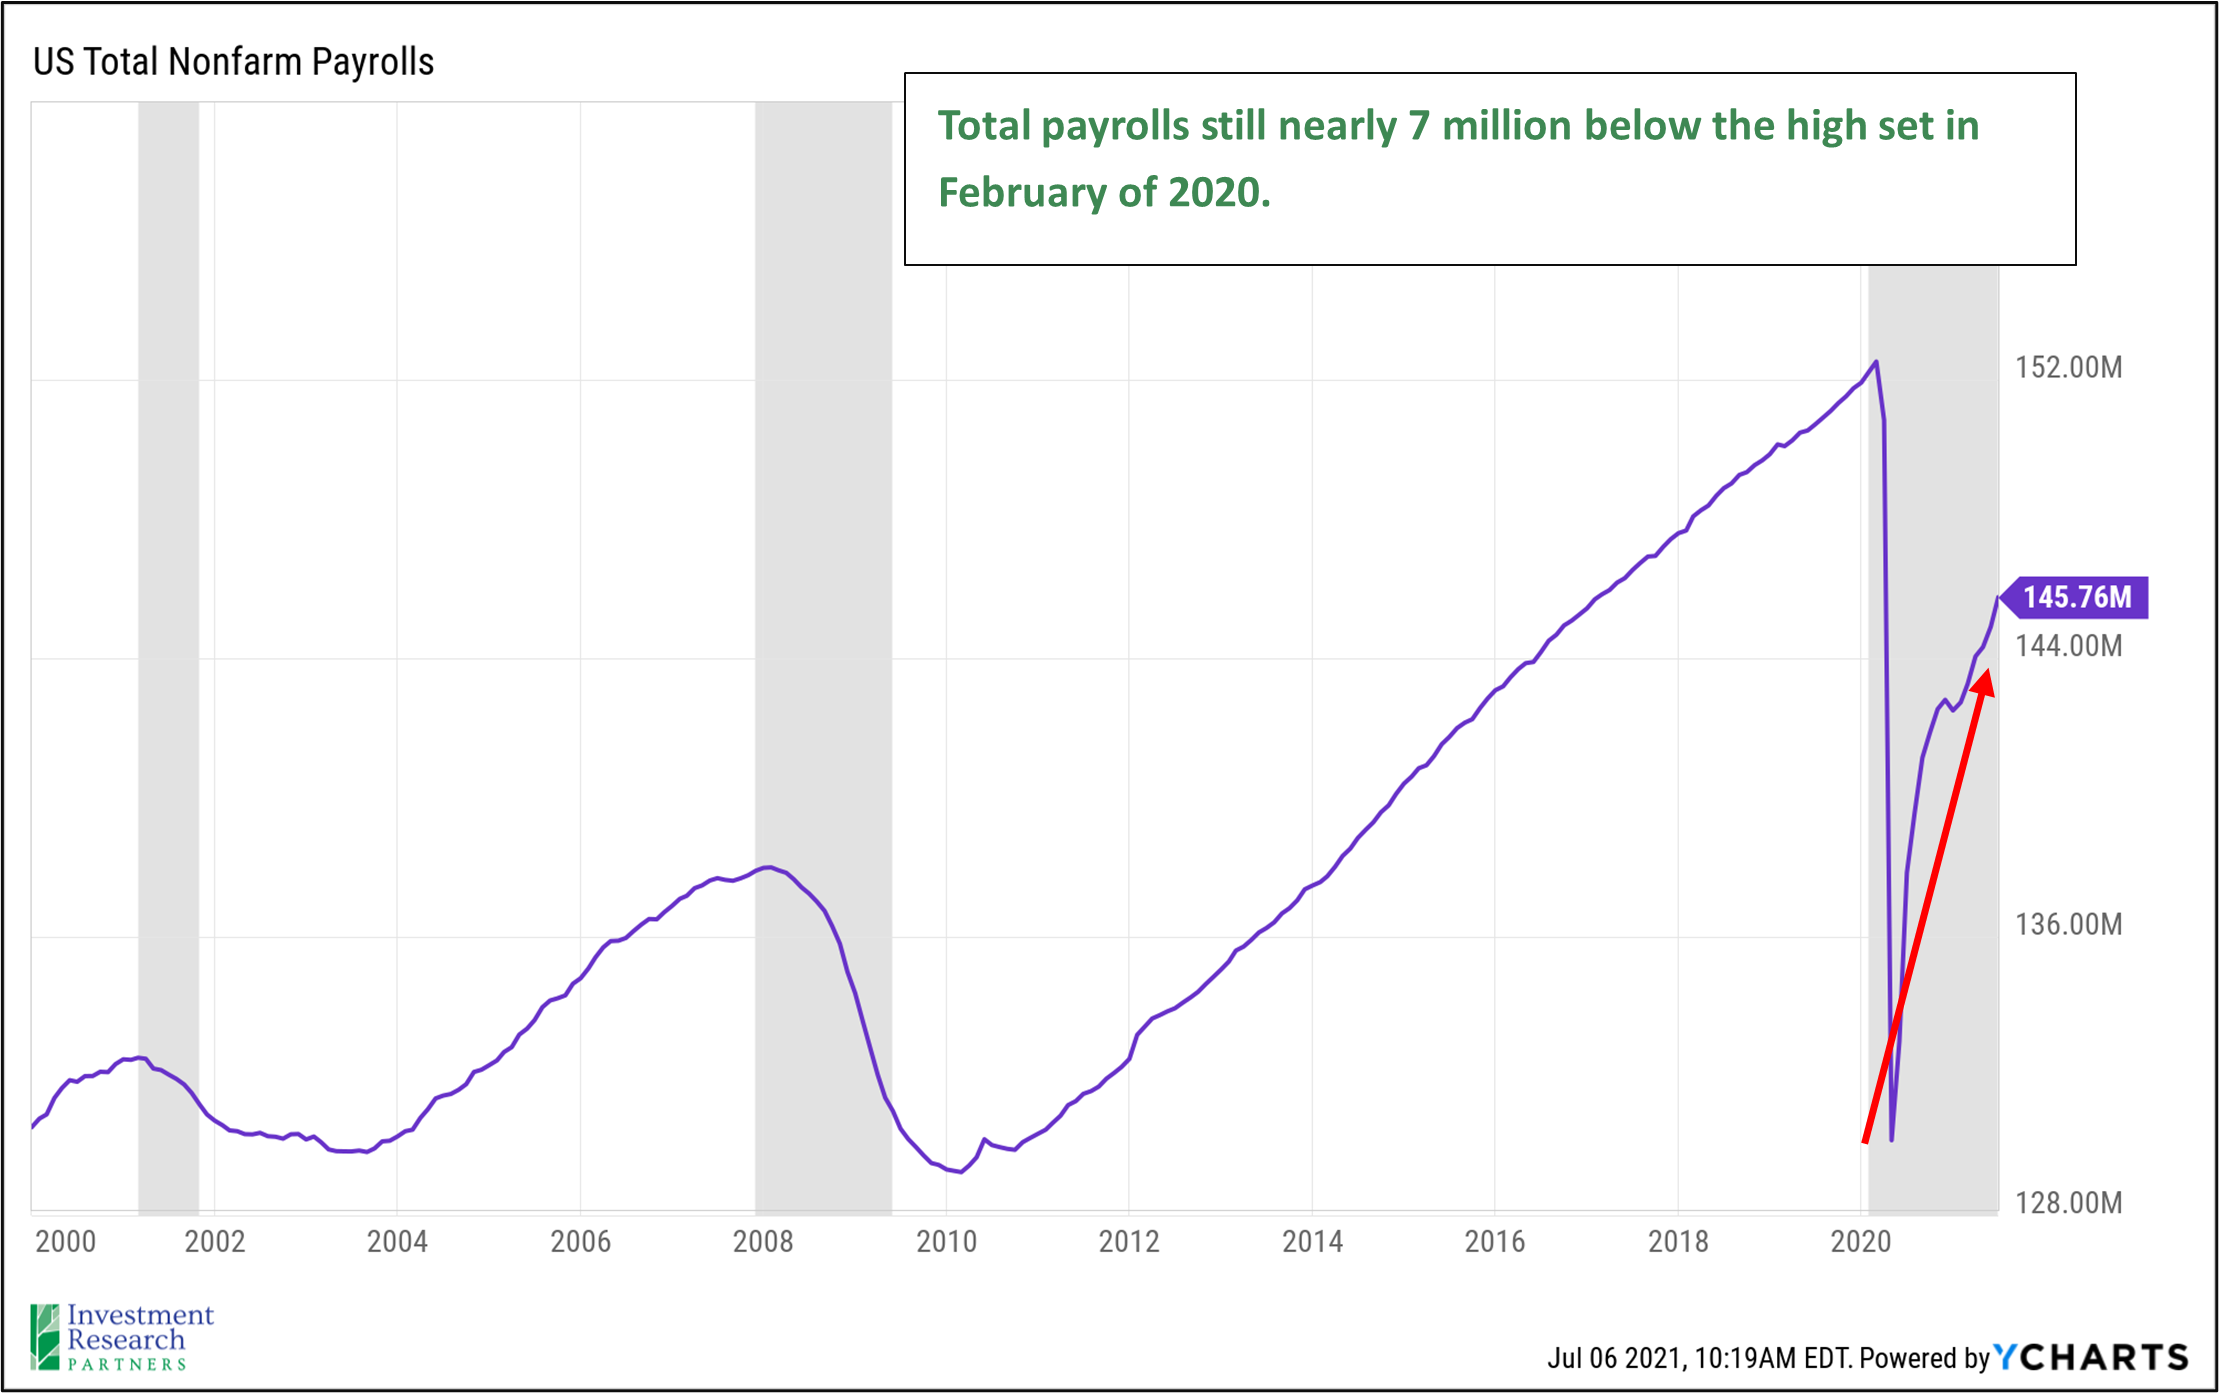
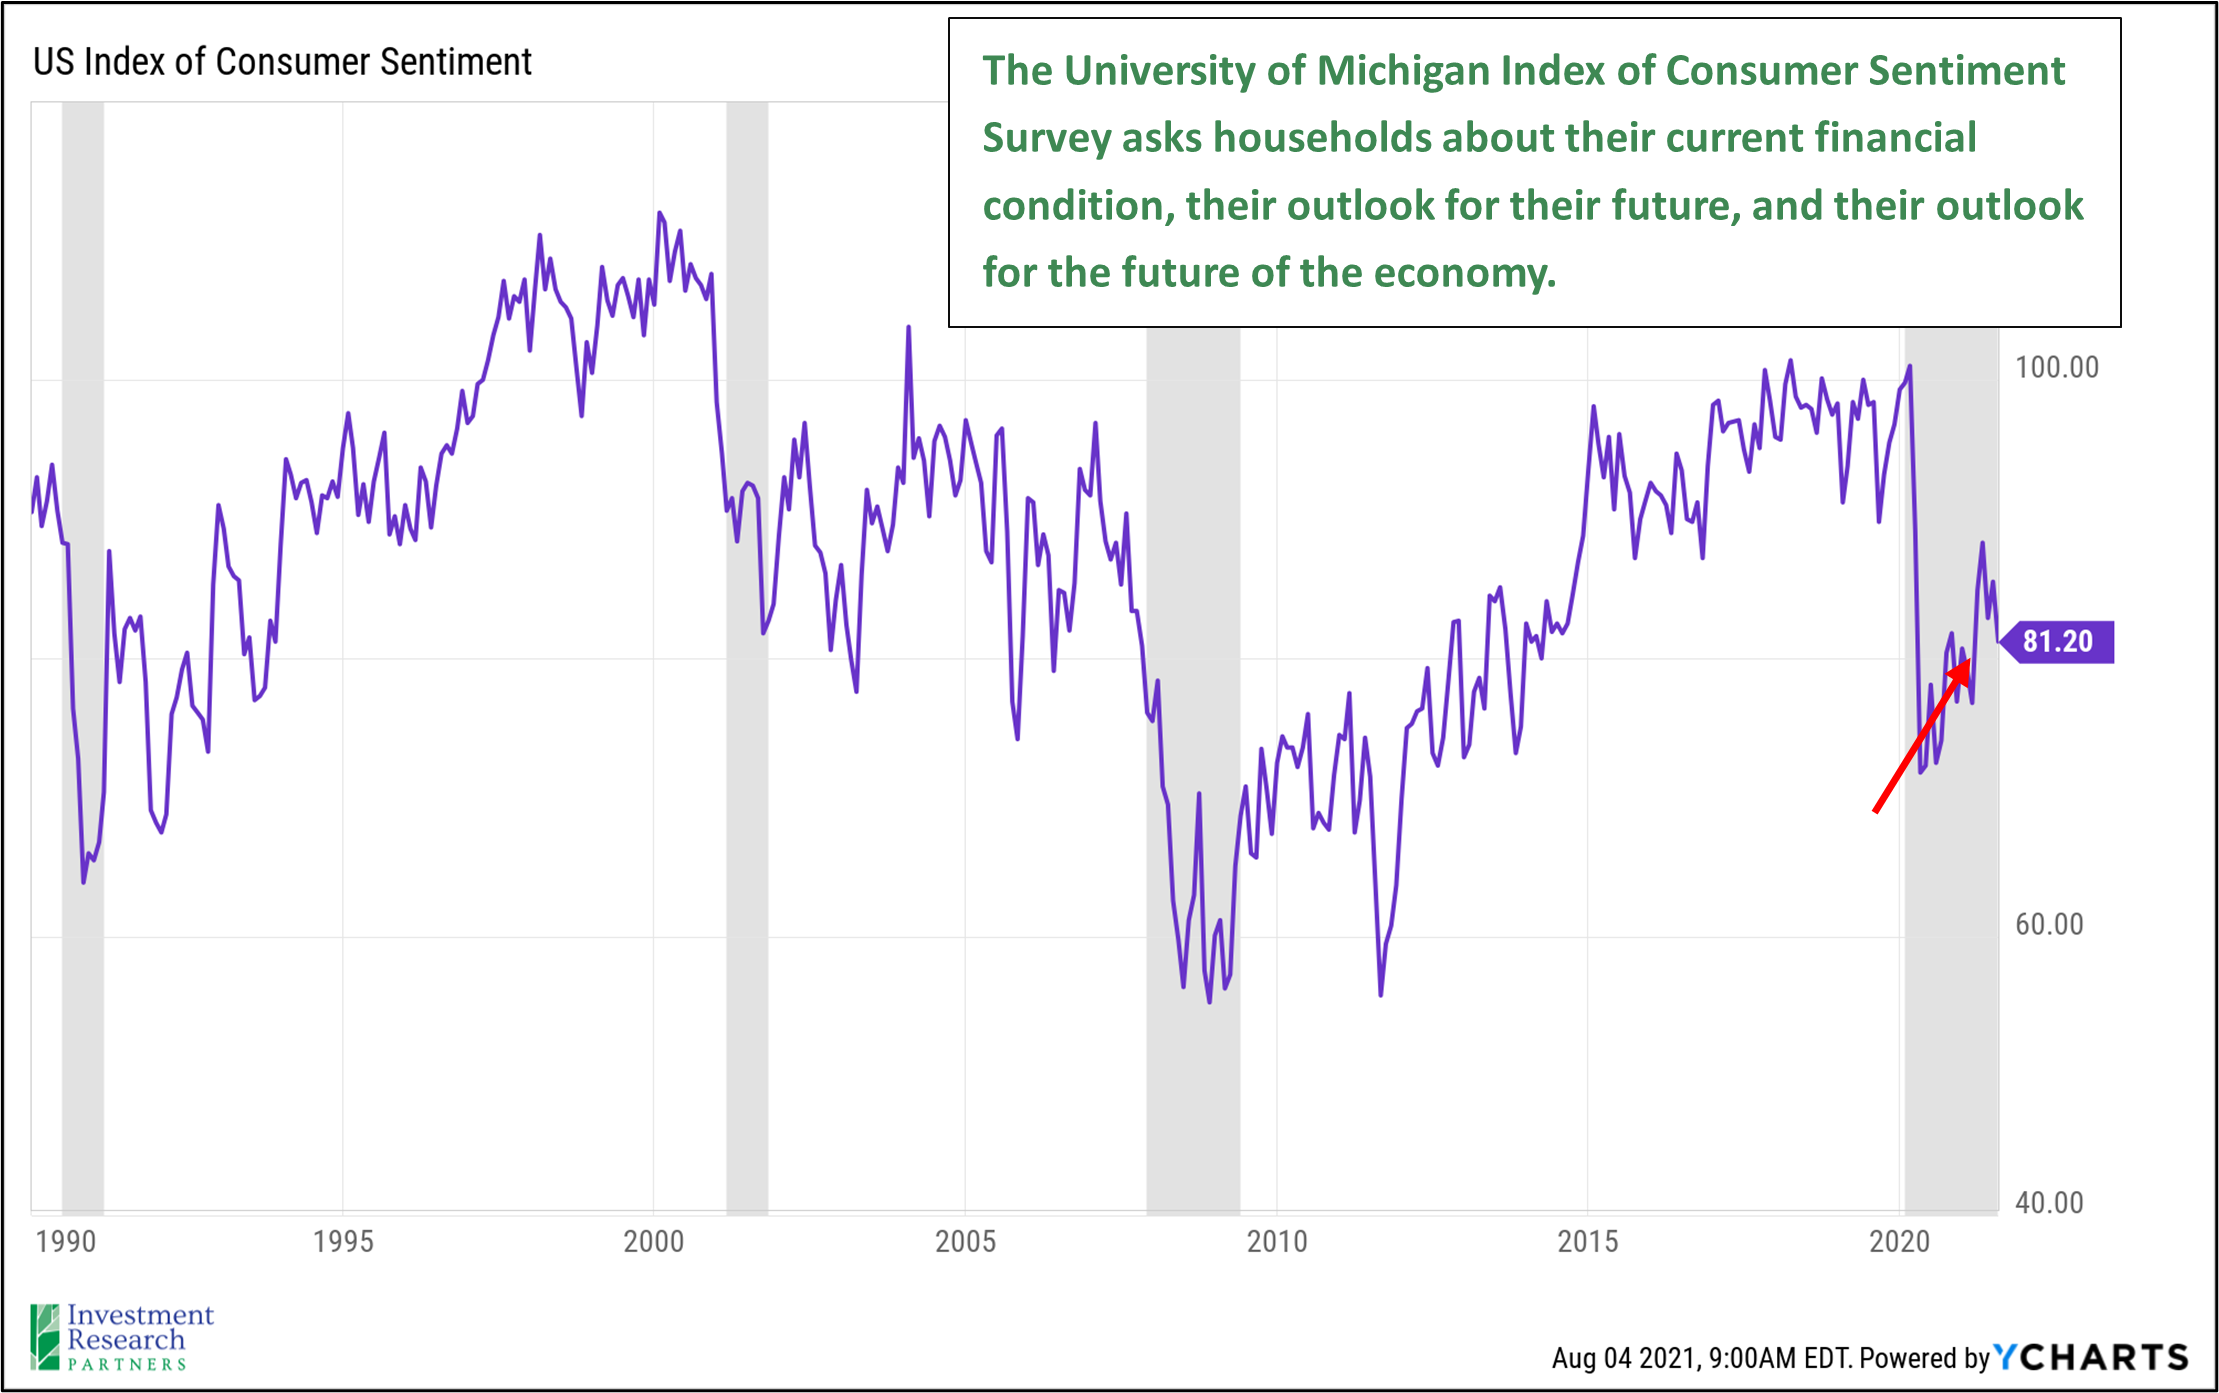
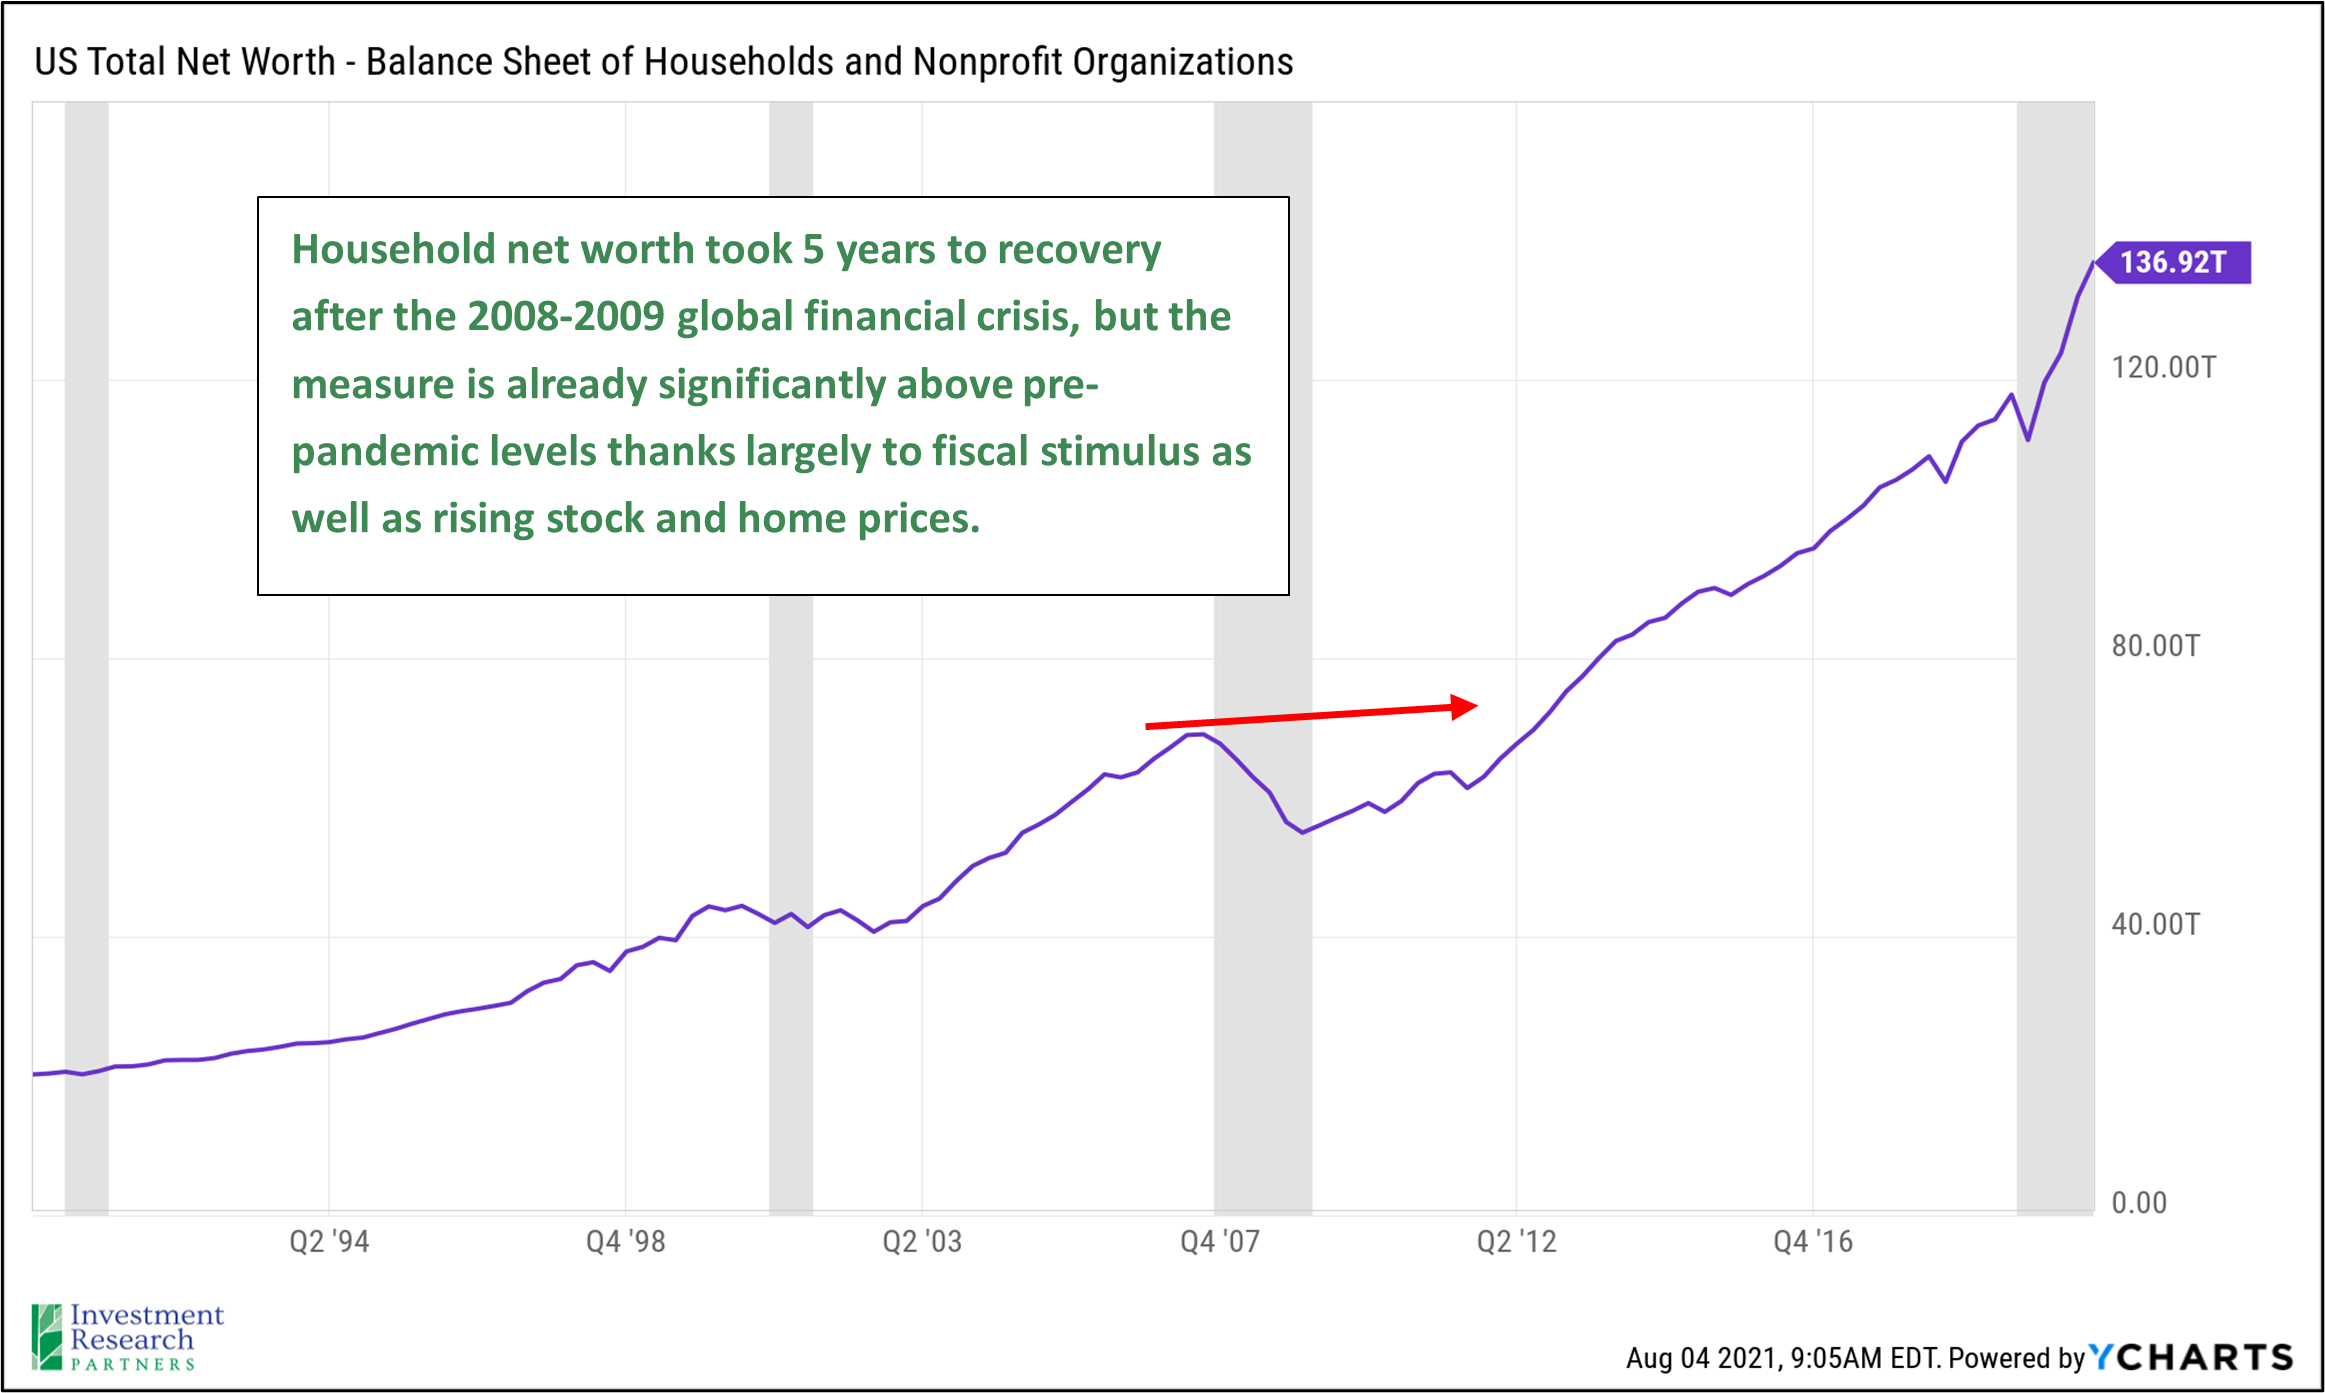
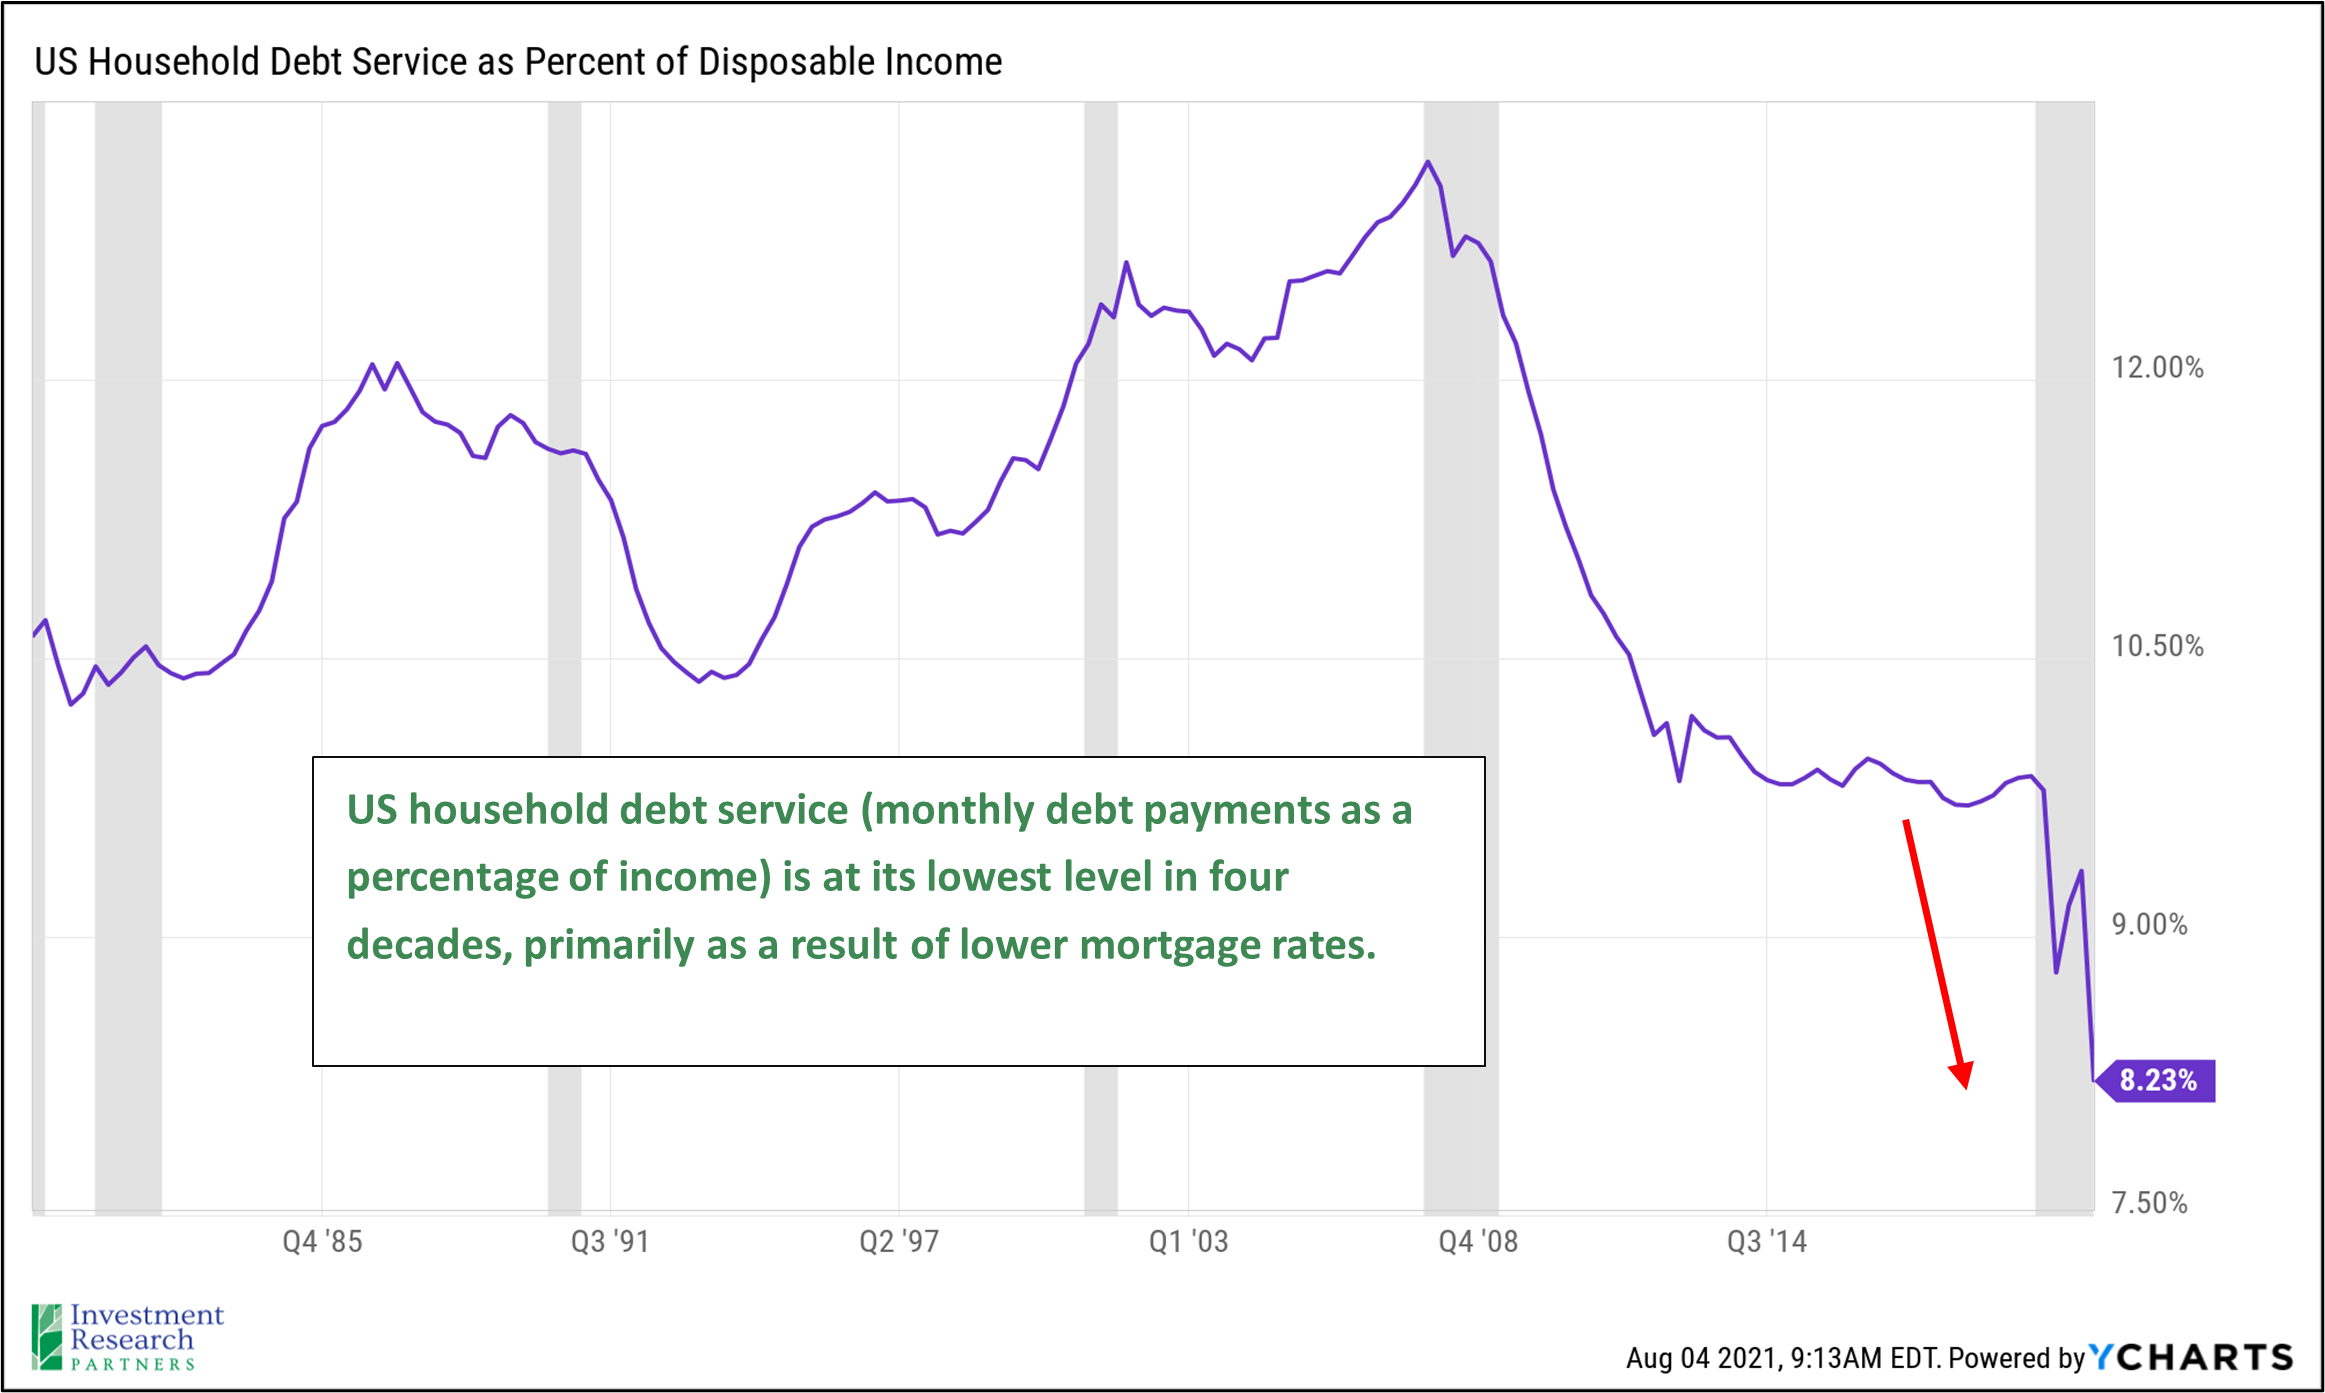
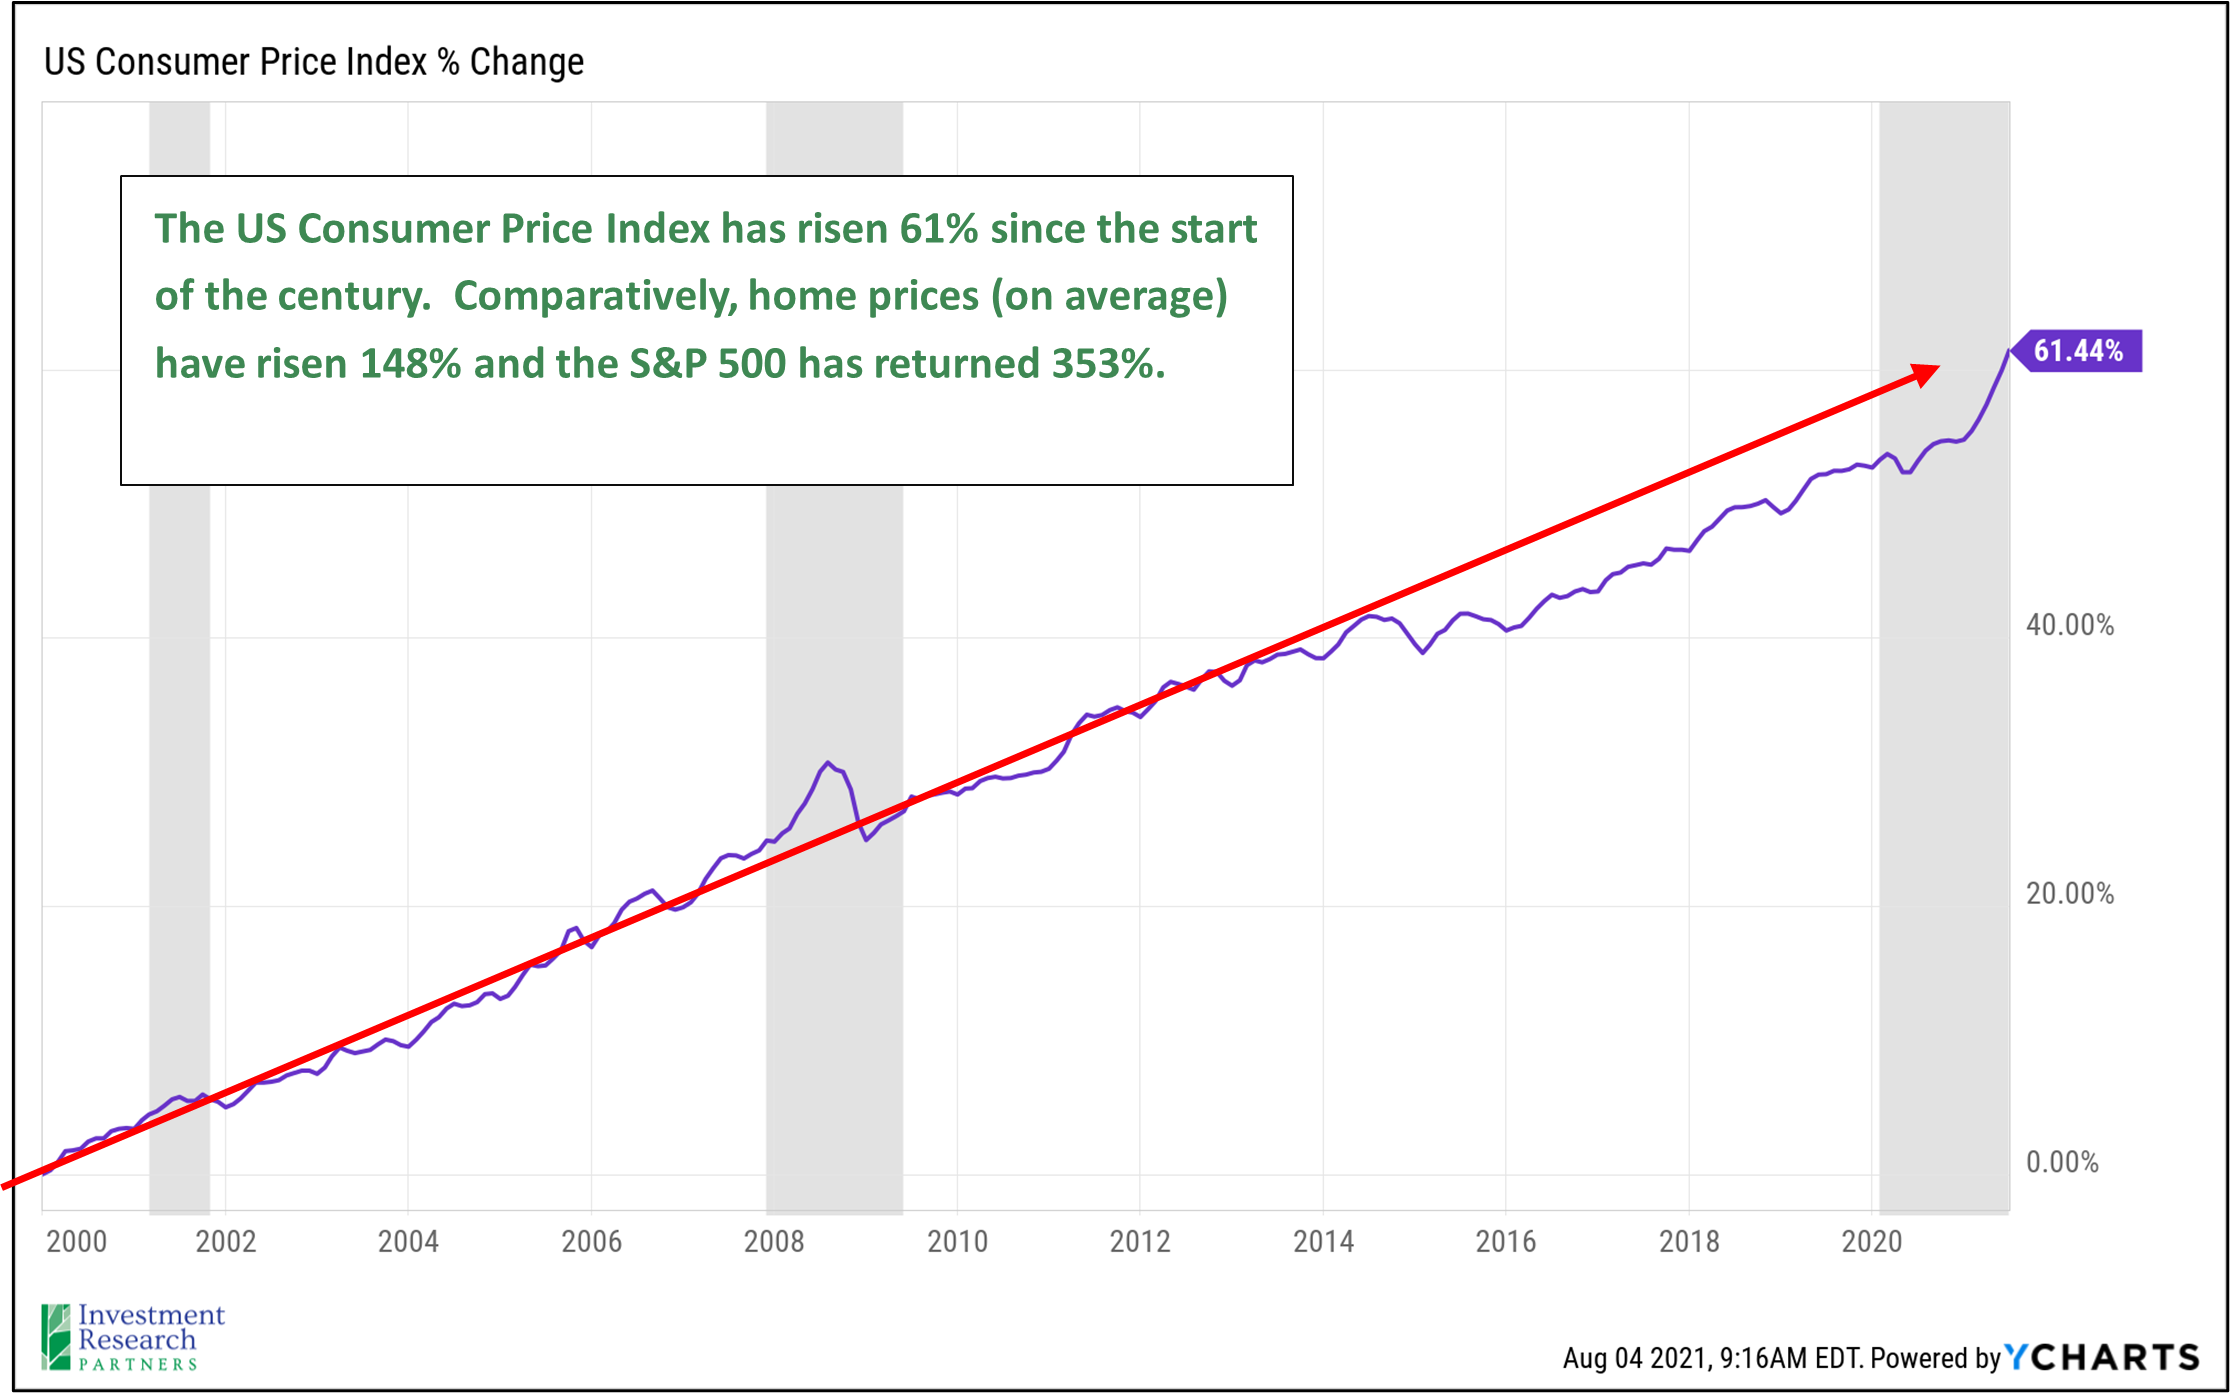
The labor market continues to improve. This Friday, consensus estimates from economists are for the July jobs report to include 875,000 net newly employed Americans with a reduction in the unemployment rate to 5.7% from 5.9%. Households (“consumers”) are responsible for approximately two-thirds of economic activity in the US. It is encouraging that the labor market continues to improve, household net worth and debt service are significantly more healthy than long-term averages, and household sentiment is trending up. The health of households and the economy has led too significant demand increases for goods and services, resulting in higher prices, which may eventually cause demand to moderate if higher prices persist.
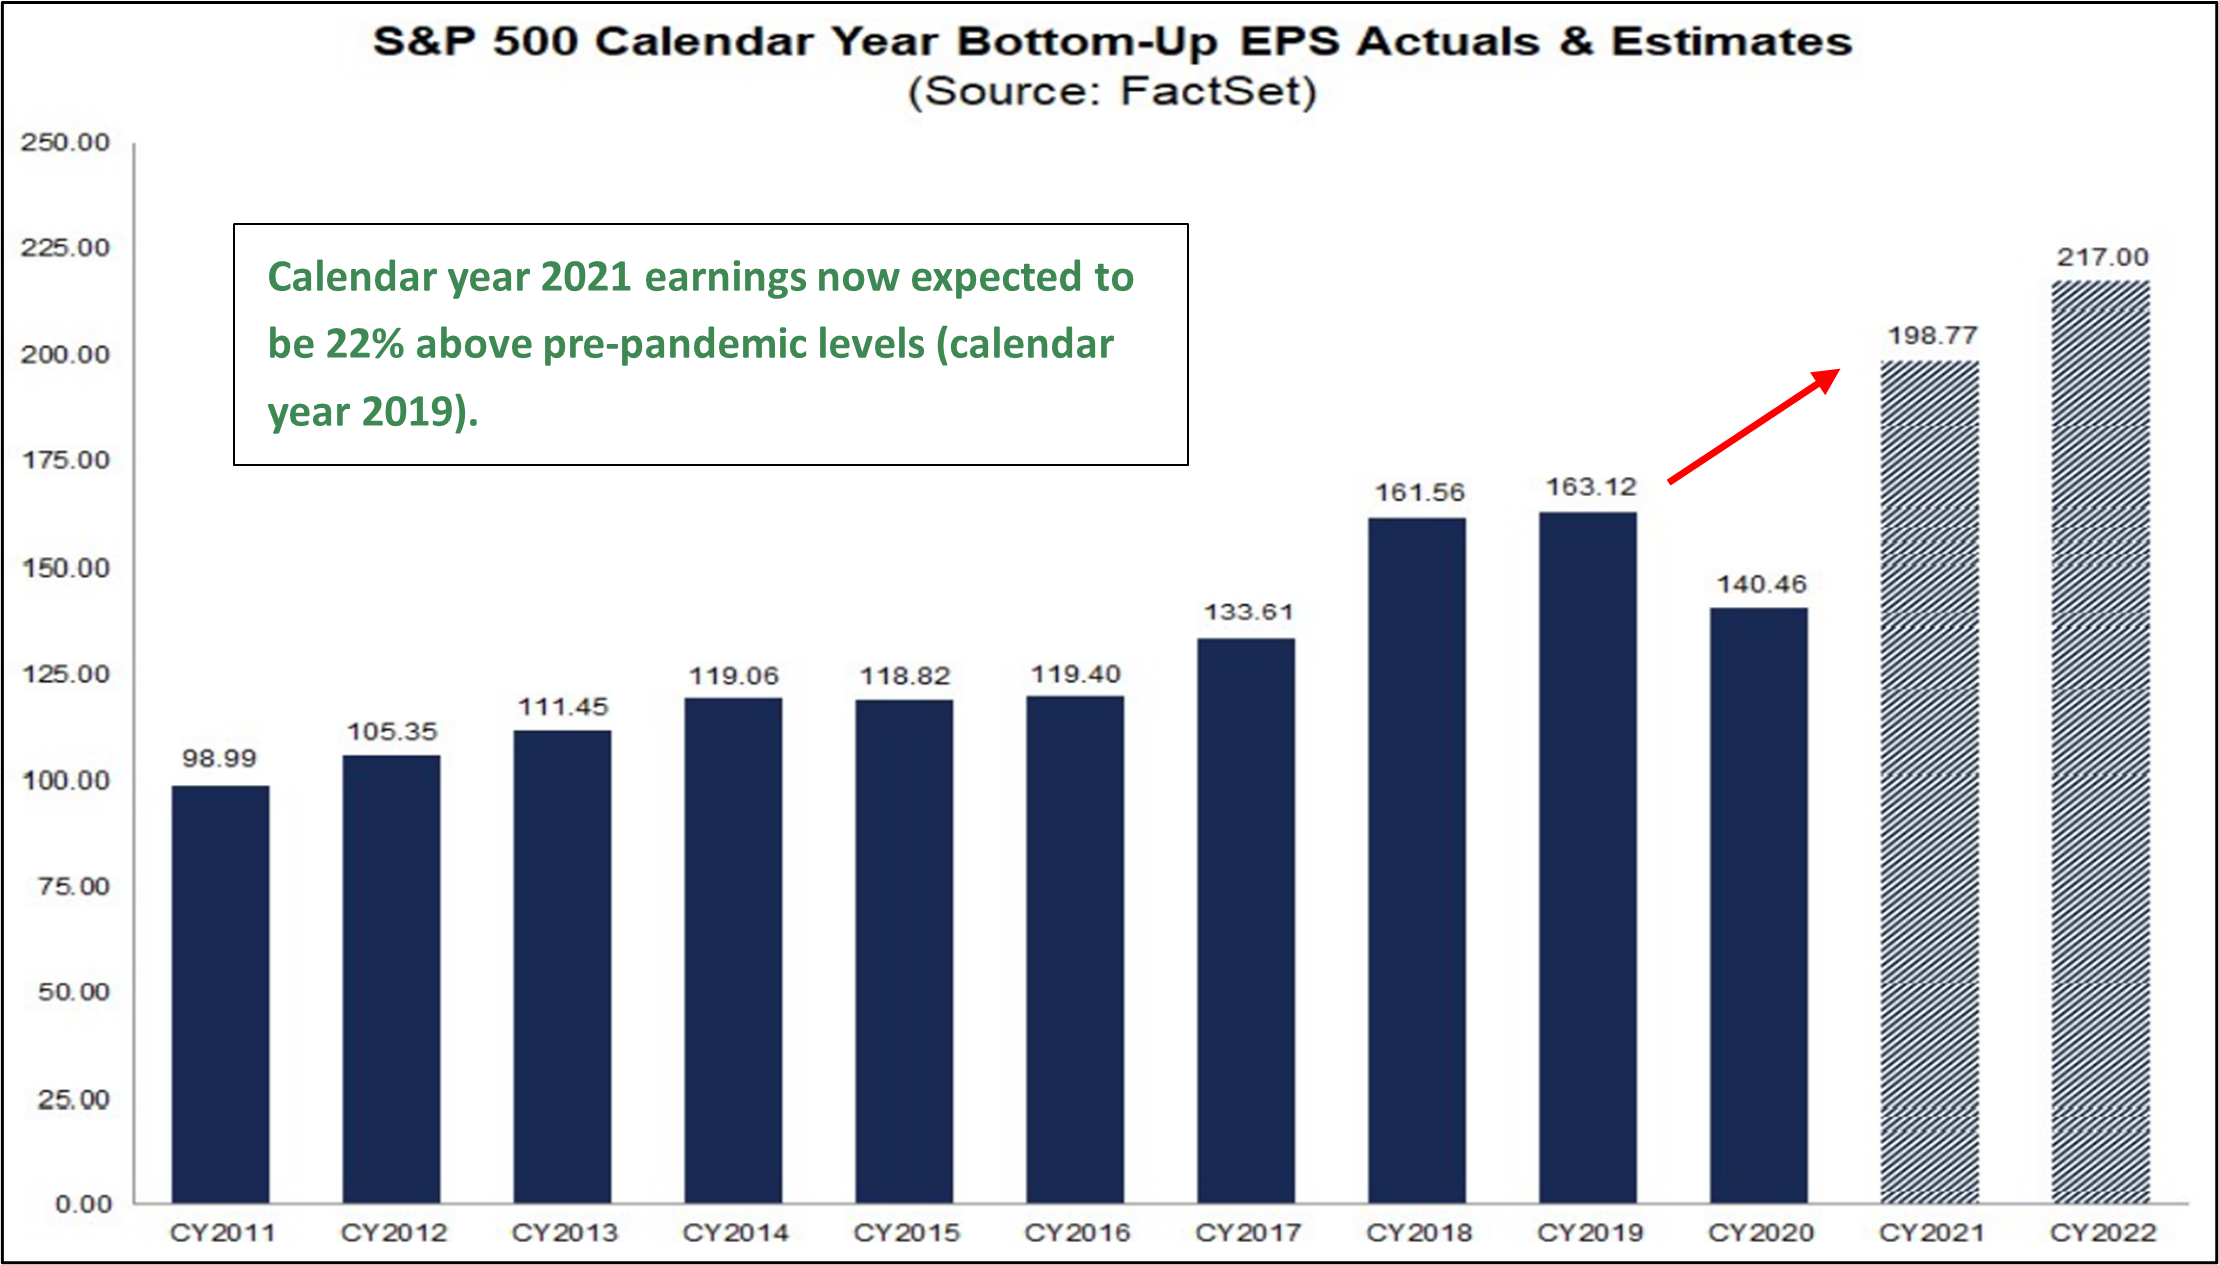
As of July 31st, nearly 60% of S&P 500 companies have reported results for the second quarter of 2021. Of those 88% have outperformed analysts’ consensus expectations for both revenue and earnings. For calendar year 2021 and 2022, consensus expectations are now for year-over-year earnings growth of 41% and 10%, respectively. These growth rates would result in index earnings of approximately $199 in 2021 and $217 in 2022, implying that investors are willing to pay 20x for next calendar year’s earnings assuming an S&P 500 index level of 4,400.
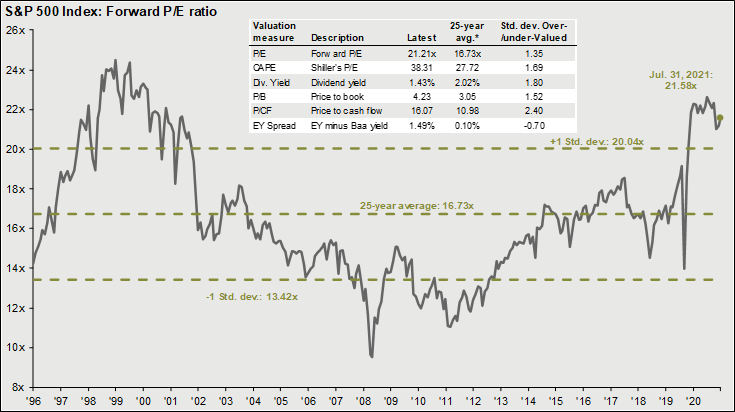
The prices for risk asset classes such as equity and credit are above long-term averages, and this input is primarily responsible for holding back our overall risk-taking score (see above). The chart below highlights the price investors are willing to pay for expected future earnings of the S&P 500 index (“forward price-to-earnings ratio”). Strong corporate earnings growth this year has helped to bring the ratio back toward more normal levels, though still elevated. When comparing the earnings yield of the S&P 500 index to US Treasury and investment grade corporate debt, the price investors are paying for the index seem more reasonable. Low interest rates have played a large role in the economic recovery as well as the increase in stock prices.
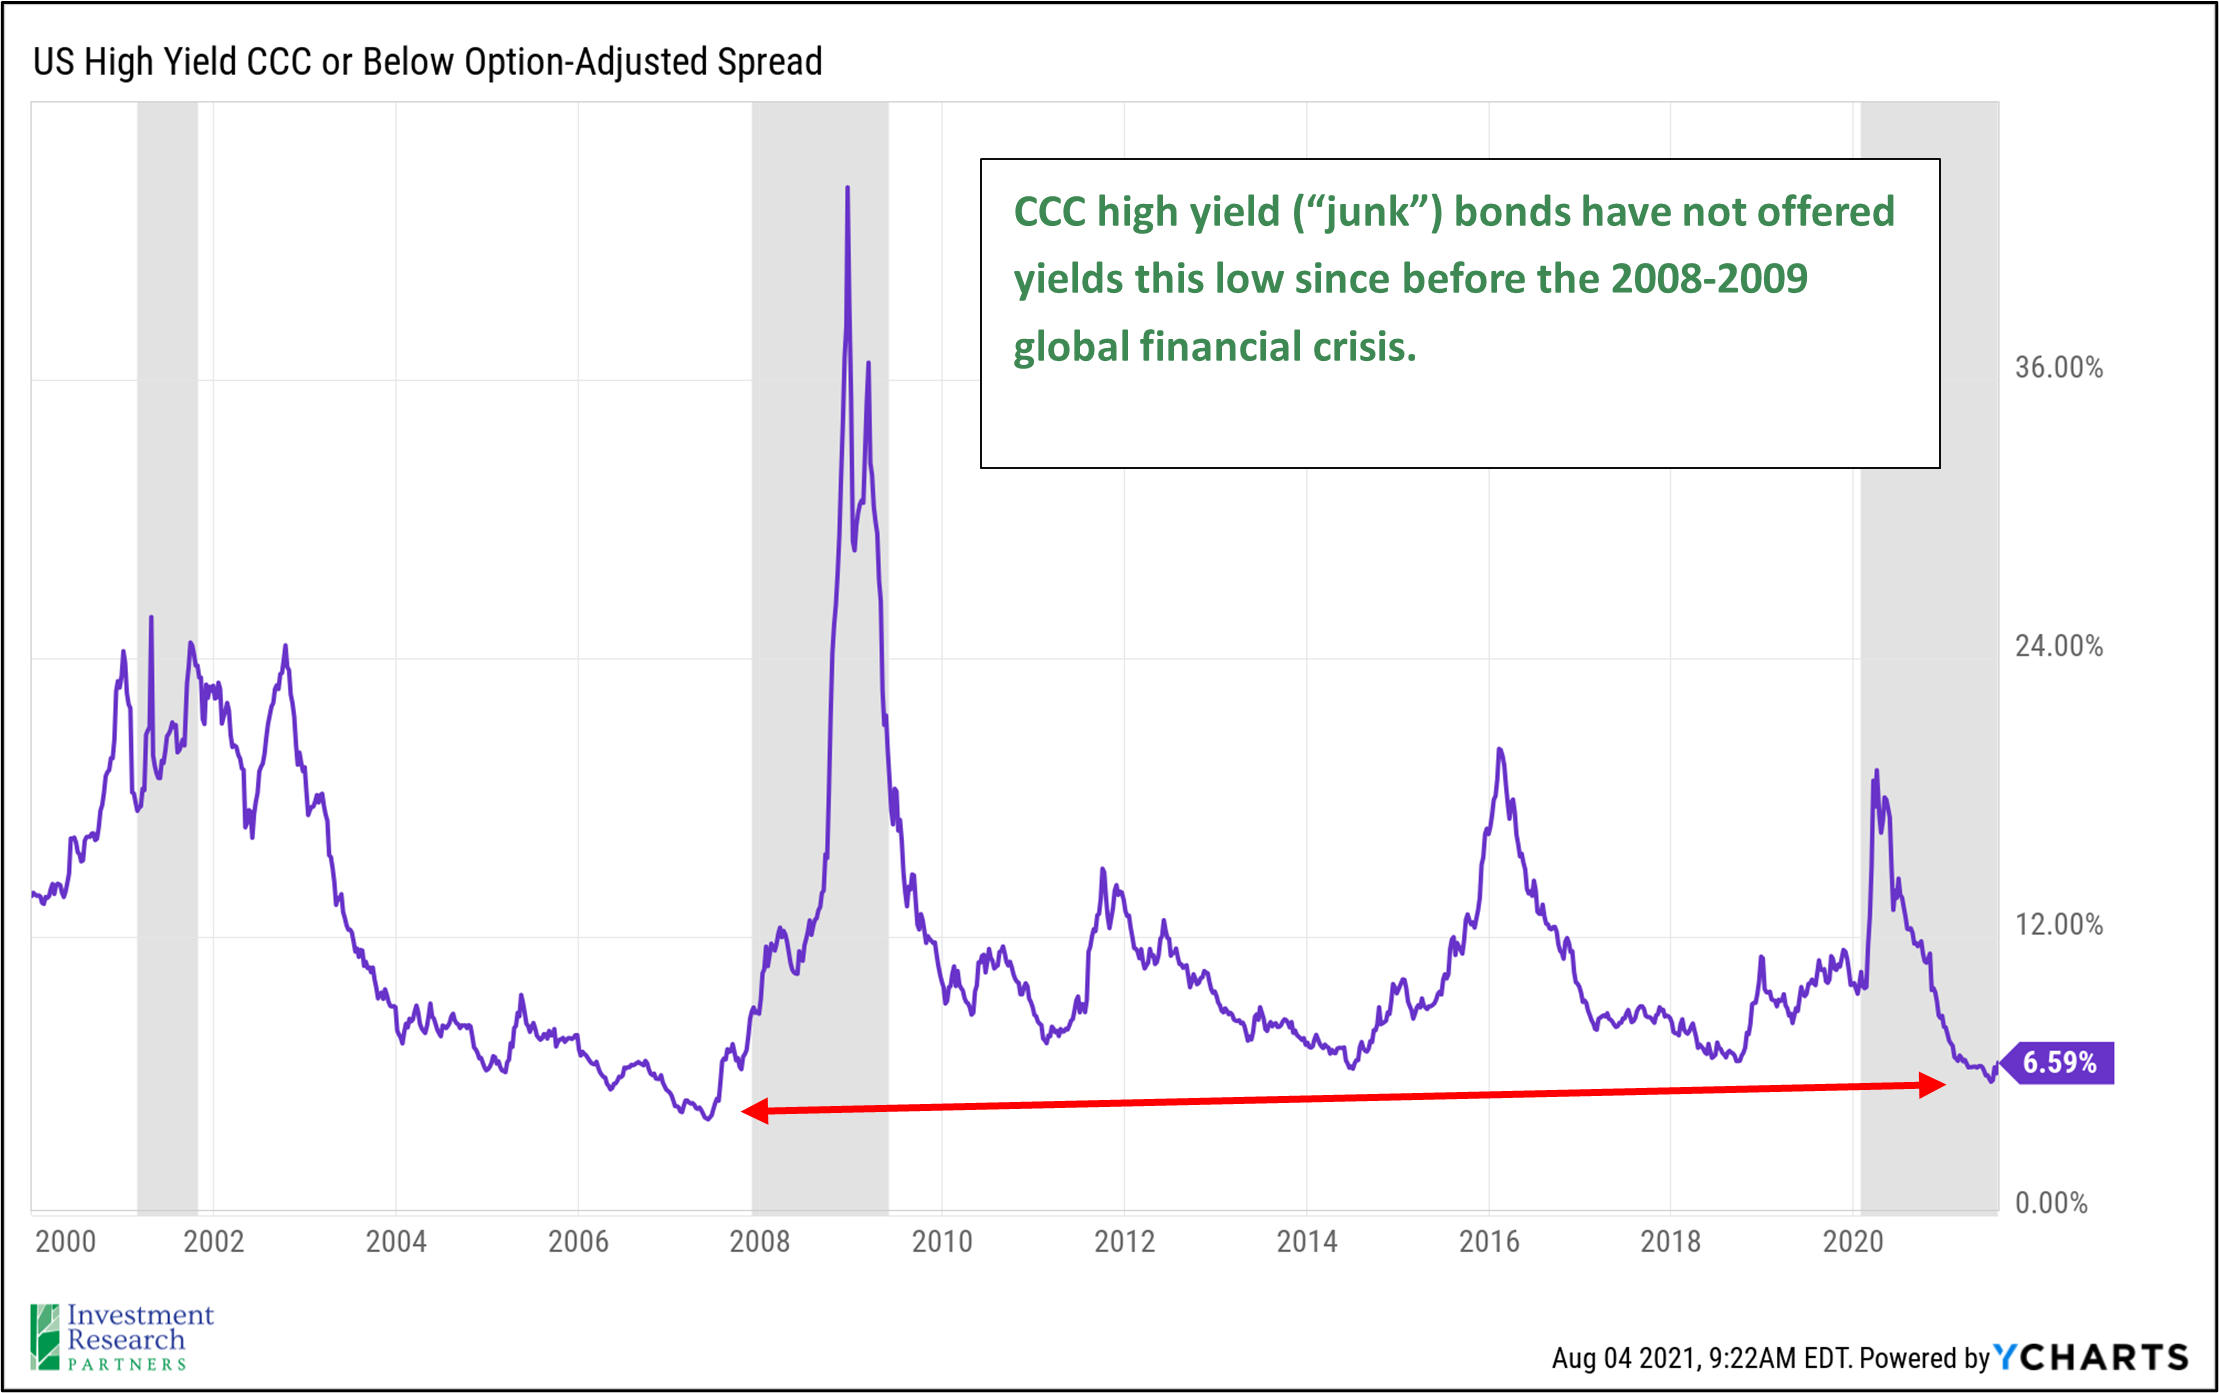
The second chart highlights the yield spread of the lowest-rated corporate bonds, which is near one of its lowest points in more than 20 years. These observations are not meant to imply that a sharp correction in asset prices is imminent, but rather that risk assets may not provide investors much cover should the economy take an unexpected turn.
Asset Class Returns
| Category | Representative Index | July 2021 | YTD 2021 | Full Year 2020 |
|---|---|---|---|---|
| Global Equity | MSCI All-Country | 0.7% | 13.1% | 16.3% |
| US Large Cap Equity | S&P 500 | 2.4% | 18.0% | 18.4% |
| US Small Cap Equity | Russell 2000 | -3.6% | 13.3% | 20.0% |
| Foreign Developed Equity | MSCI EAFE | 0.8% | 9.7% | 7.8% |
| Emerging Market Equity | MSCI Emerging Markets | -6.7% | 0.2% | 18.3% |
| US High Yield Fixed Income | ICE BofAML High Yield | 0.4% | 4.1% | 6.2% |
| US Fixed Income | Barclays Aggregate Bond | 1.1% | -0.5% | 7.5% |
| Cash Equivalents | ICE BofAML 3 Mo Deposit | 0.0% | 0.0% | 0.5% |
| Source: Morningstar (total returns shown gross of fees) As of July 31, 2021 |
Prices & Interest Rates
| Representative Index | July 31, 2021 | Year-End 2020 |
|---|---|---|
| S&P 500 | 4,390 | 3,756 |
| Dow Jones Industrial Avg. | 34,832 | 30,606 |
| NASDAQ | 14,956 | 12,888 |
| Crude Oil (US WTI) | $73.95 | $48.42 |
| Gold | $1,813 | $1,902 |
| US Dollar | 92.17 | 89.94 |
| 2 Year Treasury | 0.19% | 0.13% |
| 10 Year Treasury | 1.24% | 0.93% |
| 30 Year Treasury | 1.89% | 1.65% |
| Source: Bloomberg, US Treasury (total returns shown gross of fees) As of July 31, 2021 |
Download PDF Version
Past performance may not be representative of future results. All investments are subject to loss. Forecasts regarding the market or economy are subject to a wide range of possible outcomes. The views presented in this market update may prove to be inaccurate for a variety of factors. These views are as of the date listed above and are subject to change based on changes in fundamental economic or market-related data. Please contact your Financial Advisor in order to complete an updated risk assessment to ensure that your investment allocation is appropriate.